Privacy Notice
Shiny App Contact: Patrice Zeis
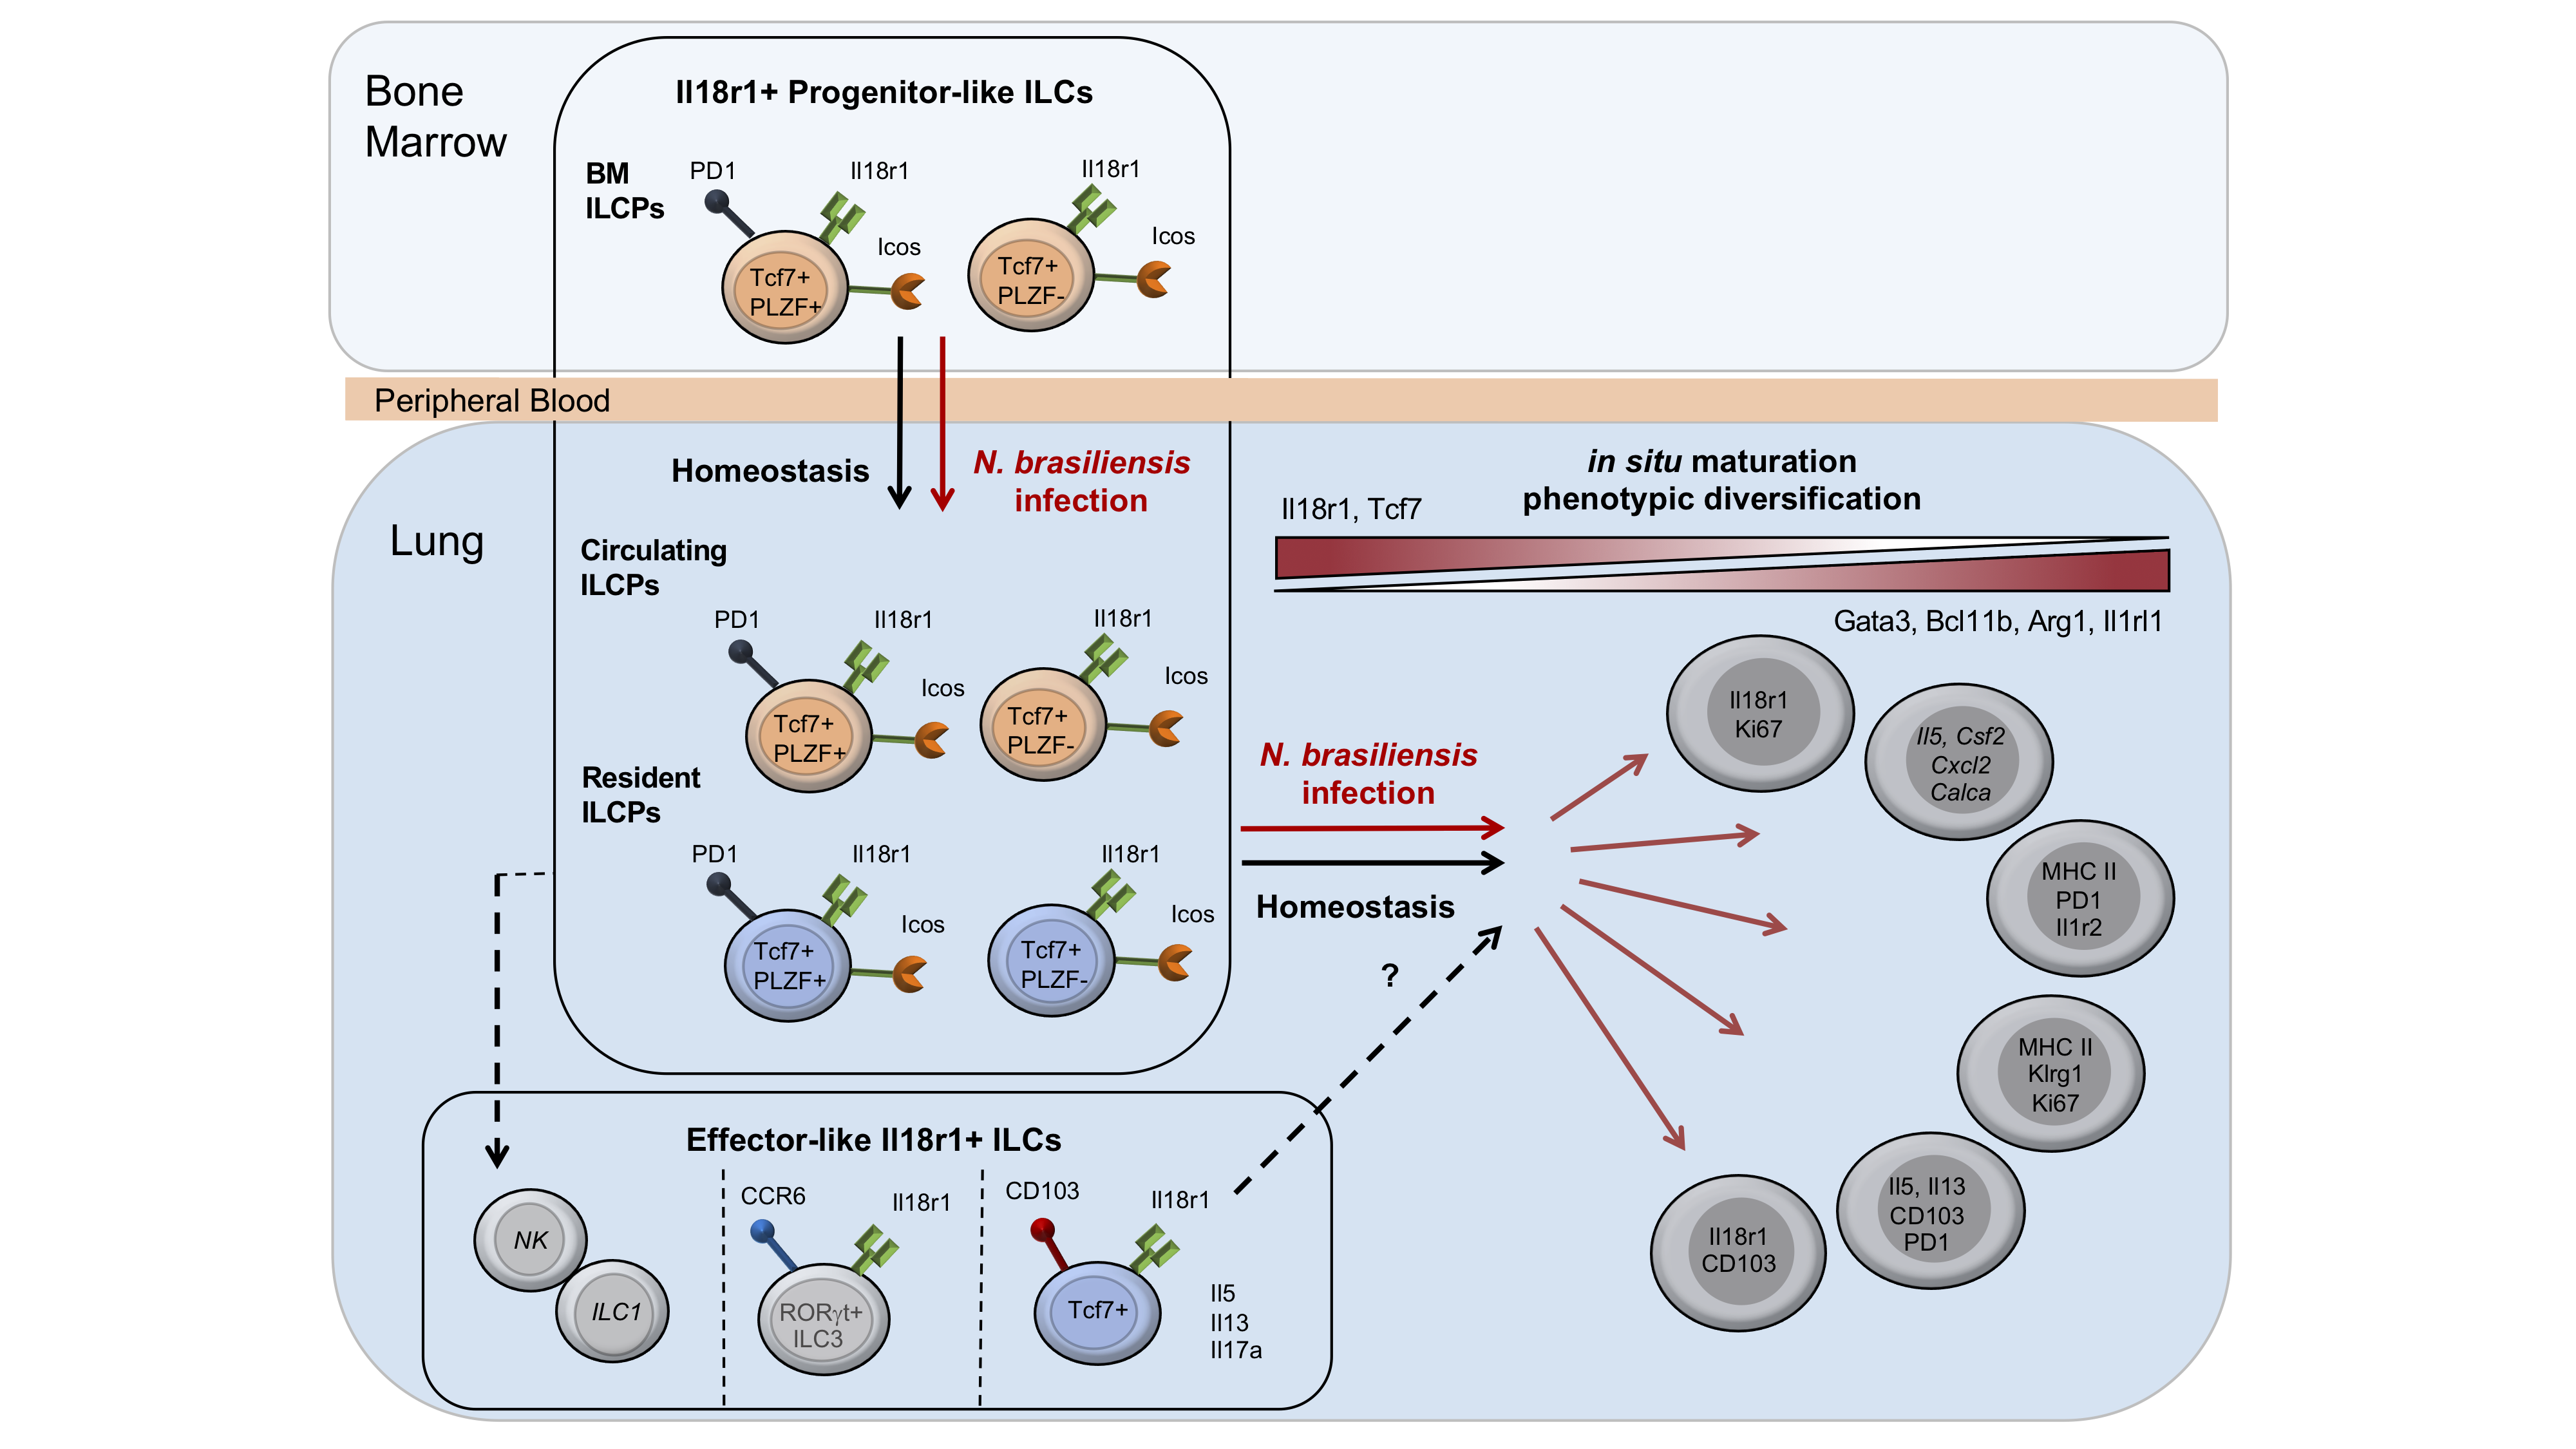
In situ maturation and tissue adaptation of type 2 innate lymphoid cell progenitors
Patrice Zeis, Mi Lian, Xiying Fan, Josip S. Herman, Daniela C. Hernandez, Rebecca Gentek, Shlomo Elias, Cornelia Symowski, Konrad Knöpper, Nina Peltokangas, Christin Friedrich, Remi Doucet-Ladeveze, Agnieszka M. Kabat, Richard M. Locksley, David Voehringer, Marc Bajenoff, Alexander Y. Rudensky, Chiara Romagnani, Dominic Grün, Georg Gasteiger
To investigate how ILCs are locally maintained, Zeis et al. generated a single cell atlas of lung ILCs and tracked Il18r1+ progenitor and effector ILC2s. Their work identifies tissue-resident and circulating ILCPs, and highlights in situ differentiation and tissue adaptation as a mechanism of ILC renewal and phenotypic diversification.
Shiny App Contact: Patrice Zeis
If red progress bar keeps appearing, shiny app is loading. Please wait patiently!Resting Lung Dataset
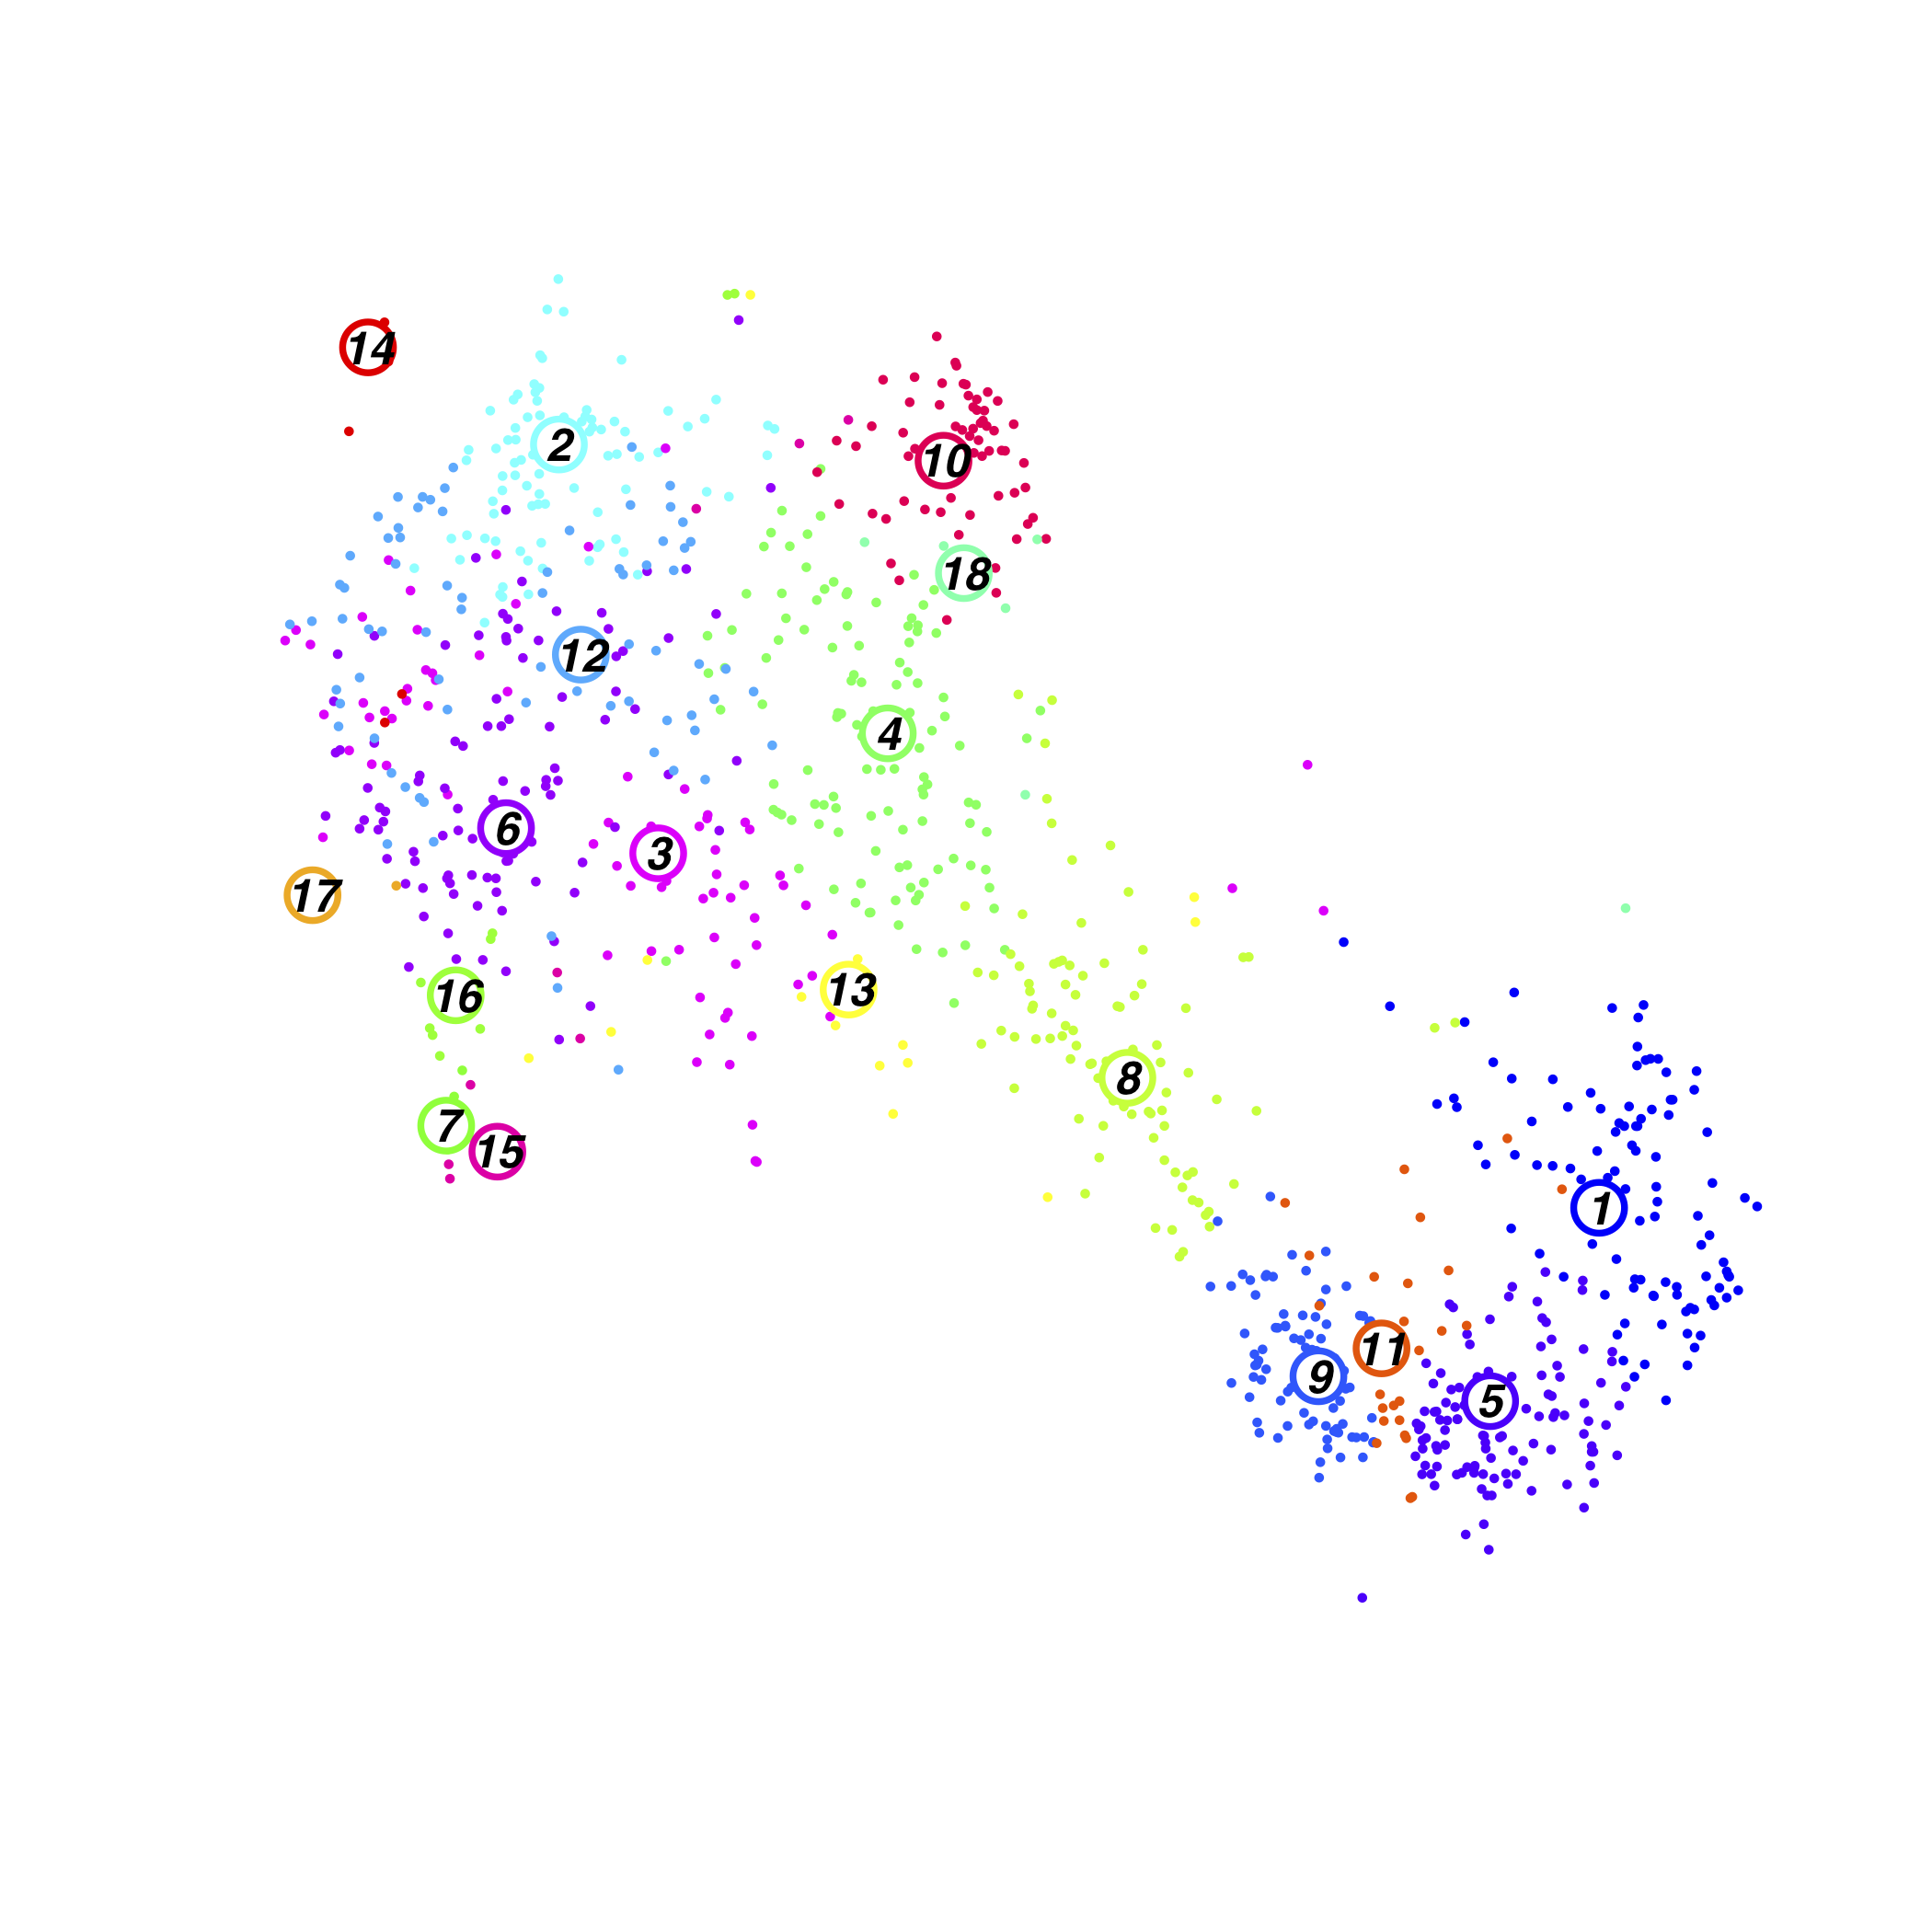
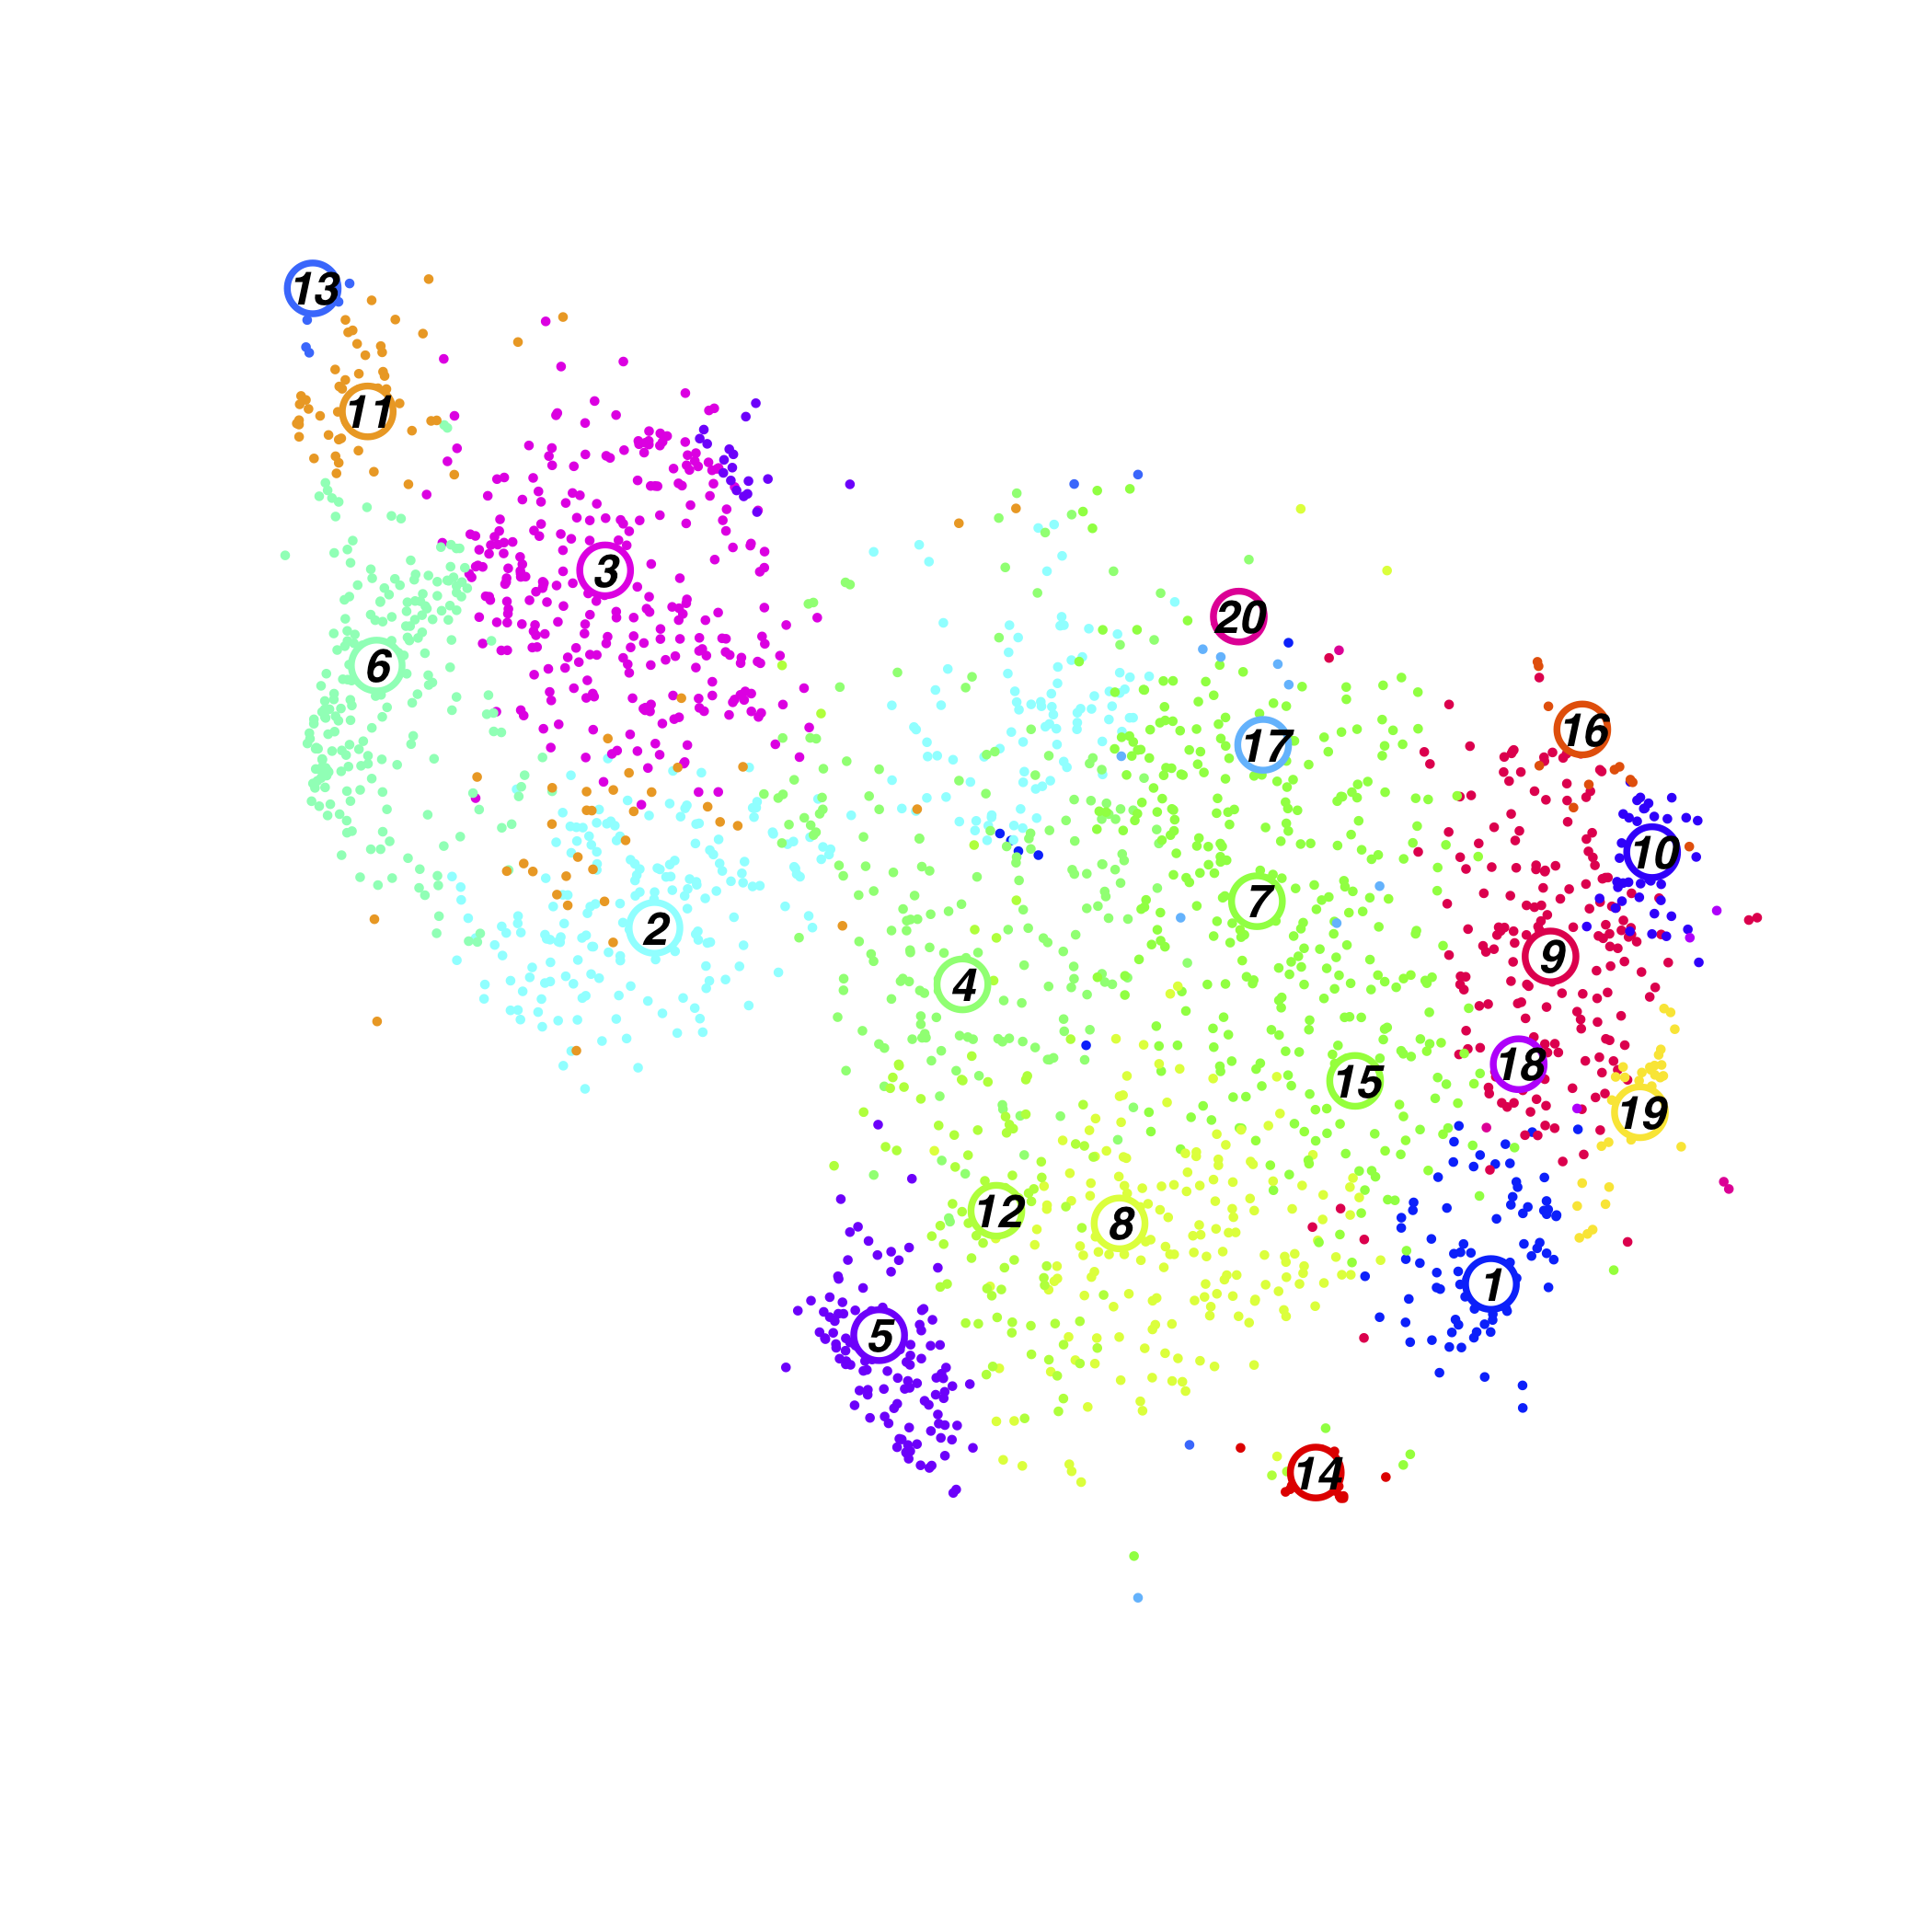
Resting Lung Cluster
FractionDotPlot for Clusters
zscore of mean expression
log2 mean expression
3 Genes Scatterplot
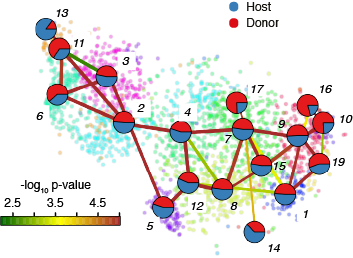
Lineage Tree
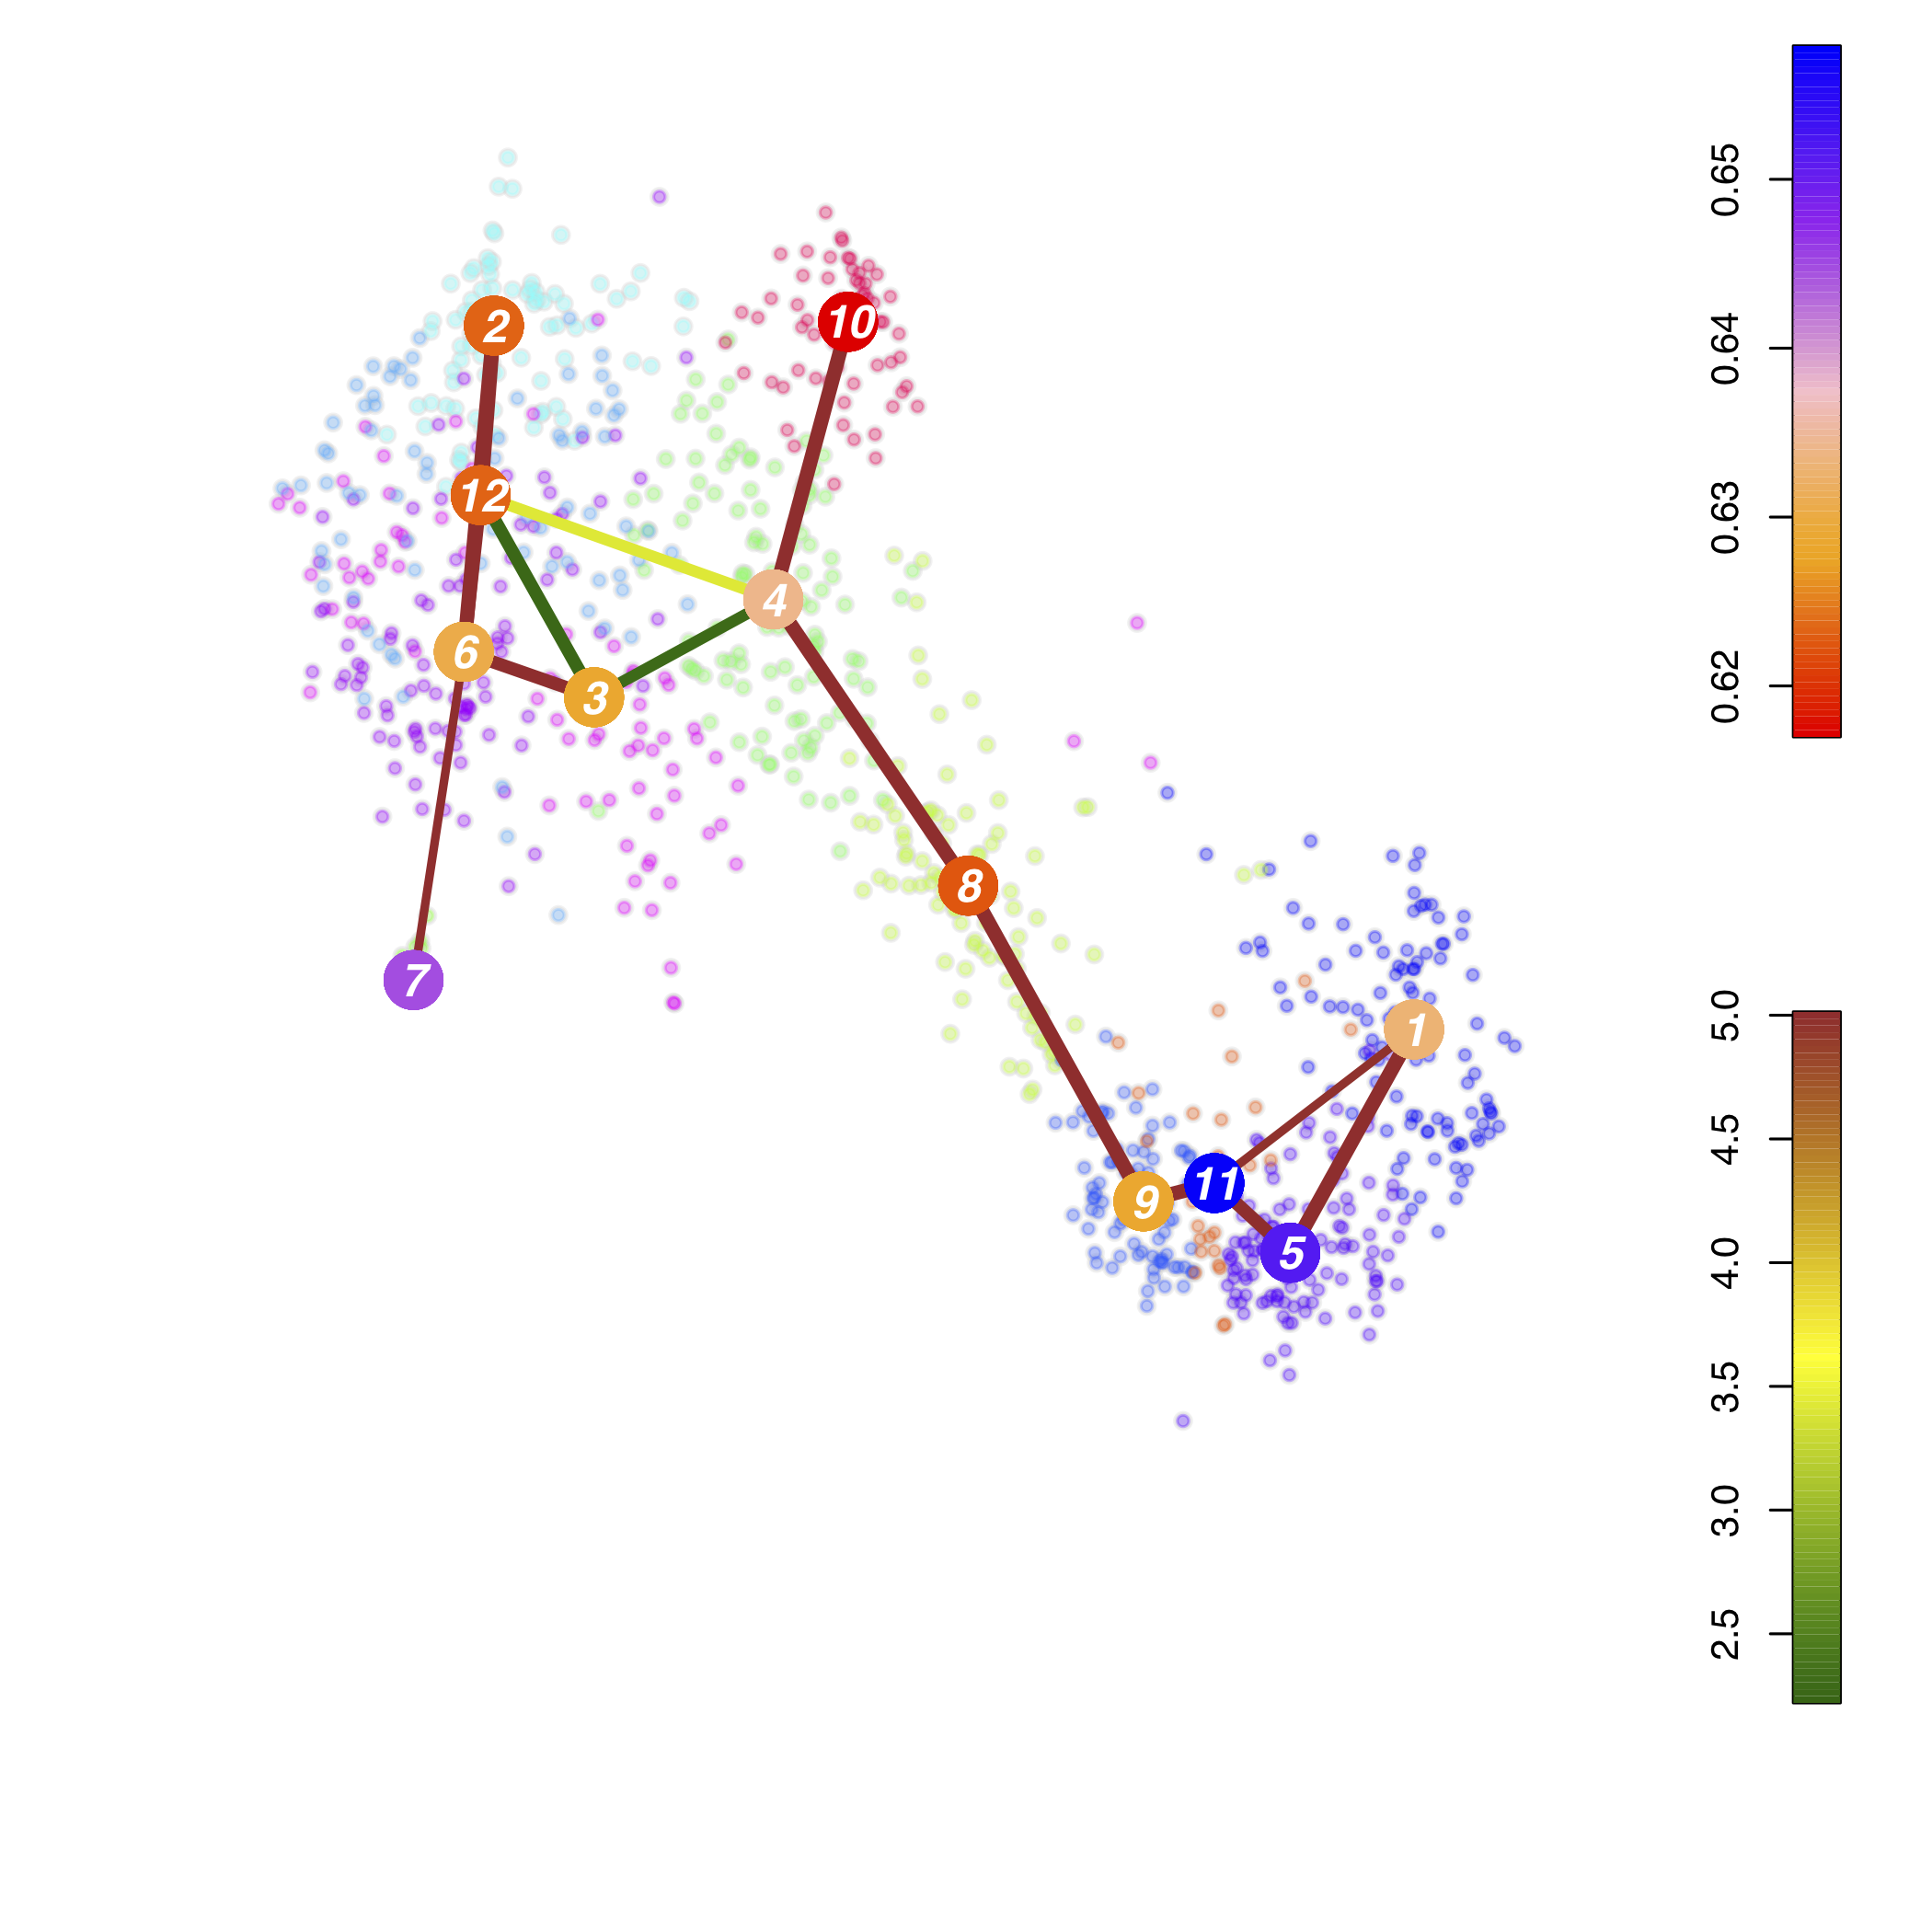
Trajectory Analysis
trajectory 5>11>9>8>4>10
trajectory 5>11>9>8>4>12
Differential Expression Cluster versus all other
mean.cl = mean expression within cluster, mean.other.cl = mean expression in all other cluster, log2FC = log2 Foldchange selected clusters versus all other
pval = p-value, padj = adjusted p-value
Differential Expression Cluster1 against Cluster2
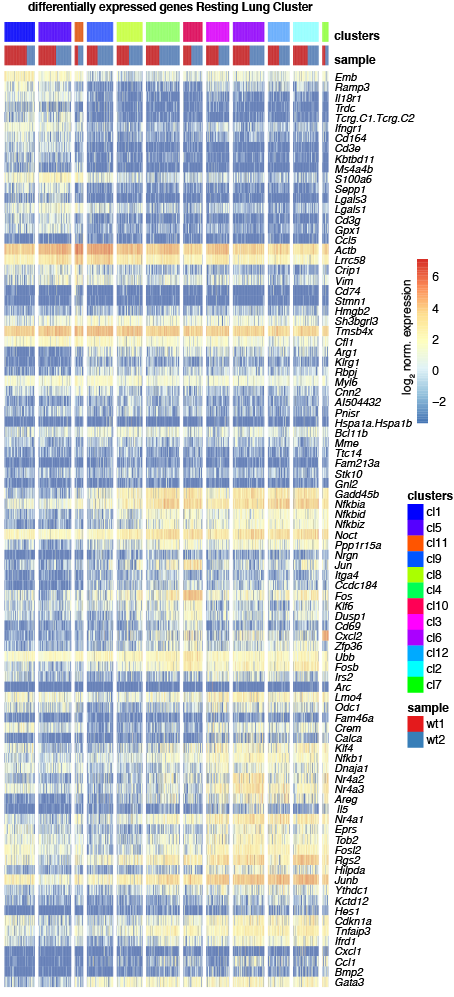
Heatmap showing the log2 normalized expression of the top 10 differentially expressed genes (P<0.05, Methods) in increasing order of p-values across clusters (y-axis) and cells (x-axis). Duplicated genes and ensemble of Gm-, RP-, Rik-, Rpl- and Rps genes were removed if present. Differentially expressed genes were obtained by comparing gene expression of cells of the respective cluster to all other clusters. Color bars indicate RaceID3 cluster and sample-of-origin for each cell.
Shiny App Contact: Patrice Zeis
If red progress bar keeps appearing, shiny app is loading. Please wait patiently!Neonatal Lung Dataset
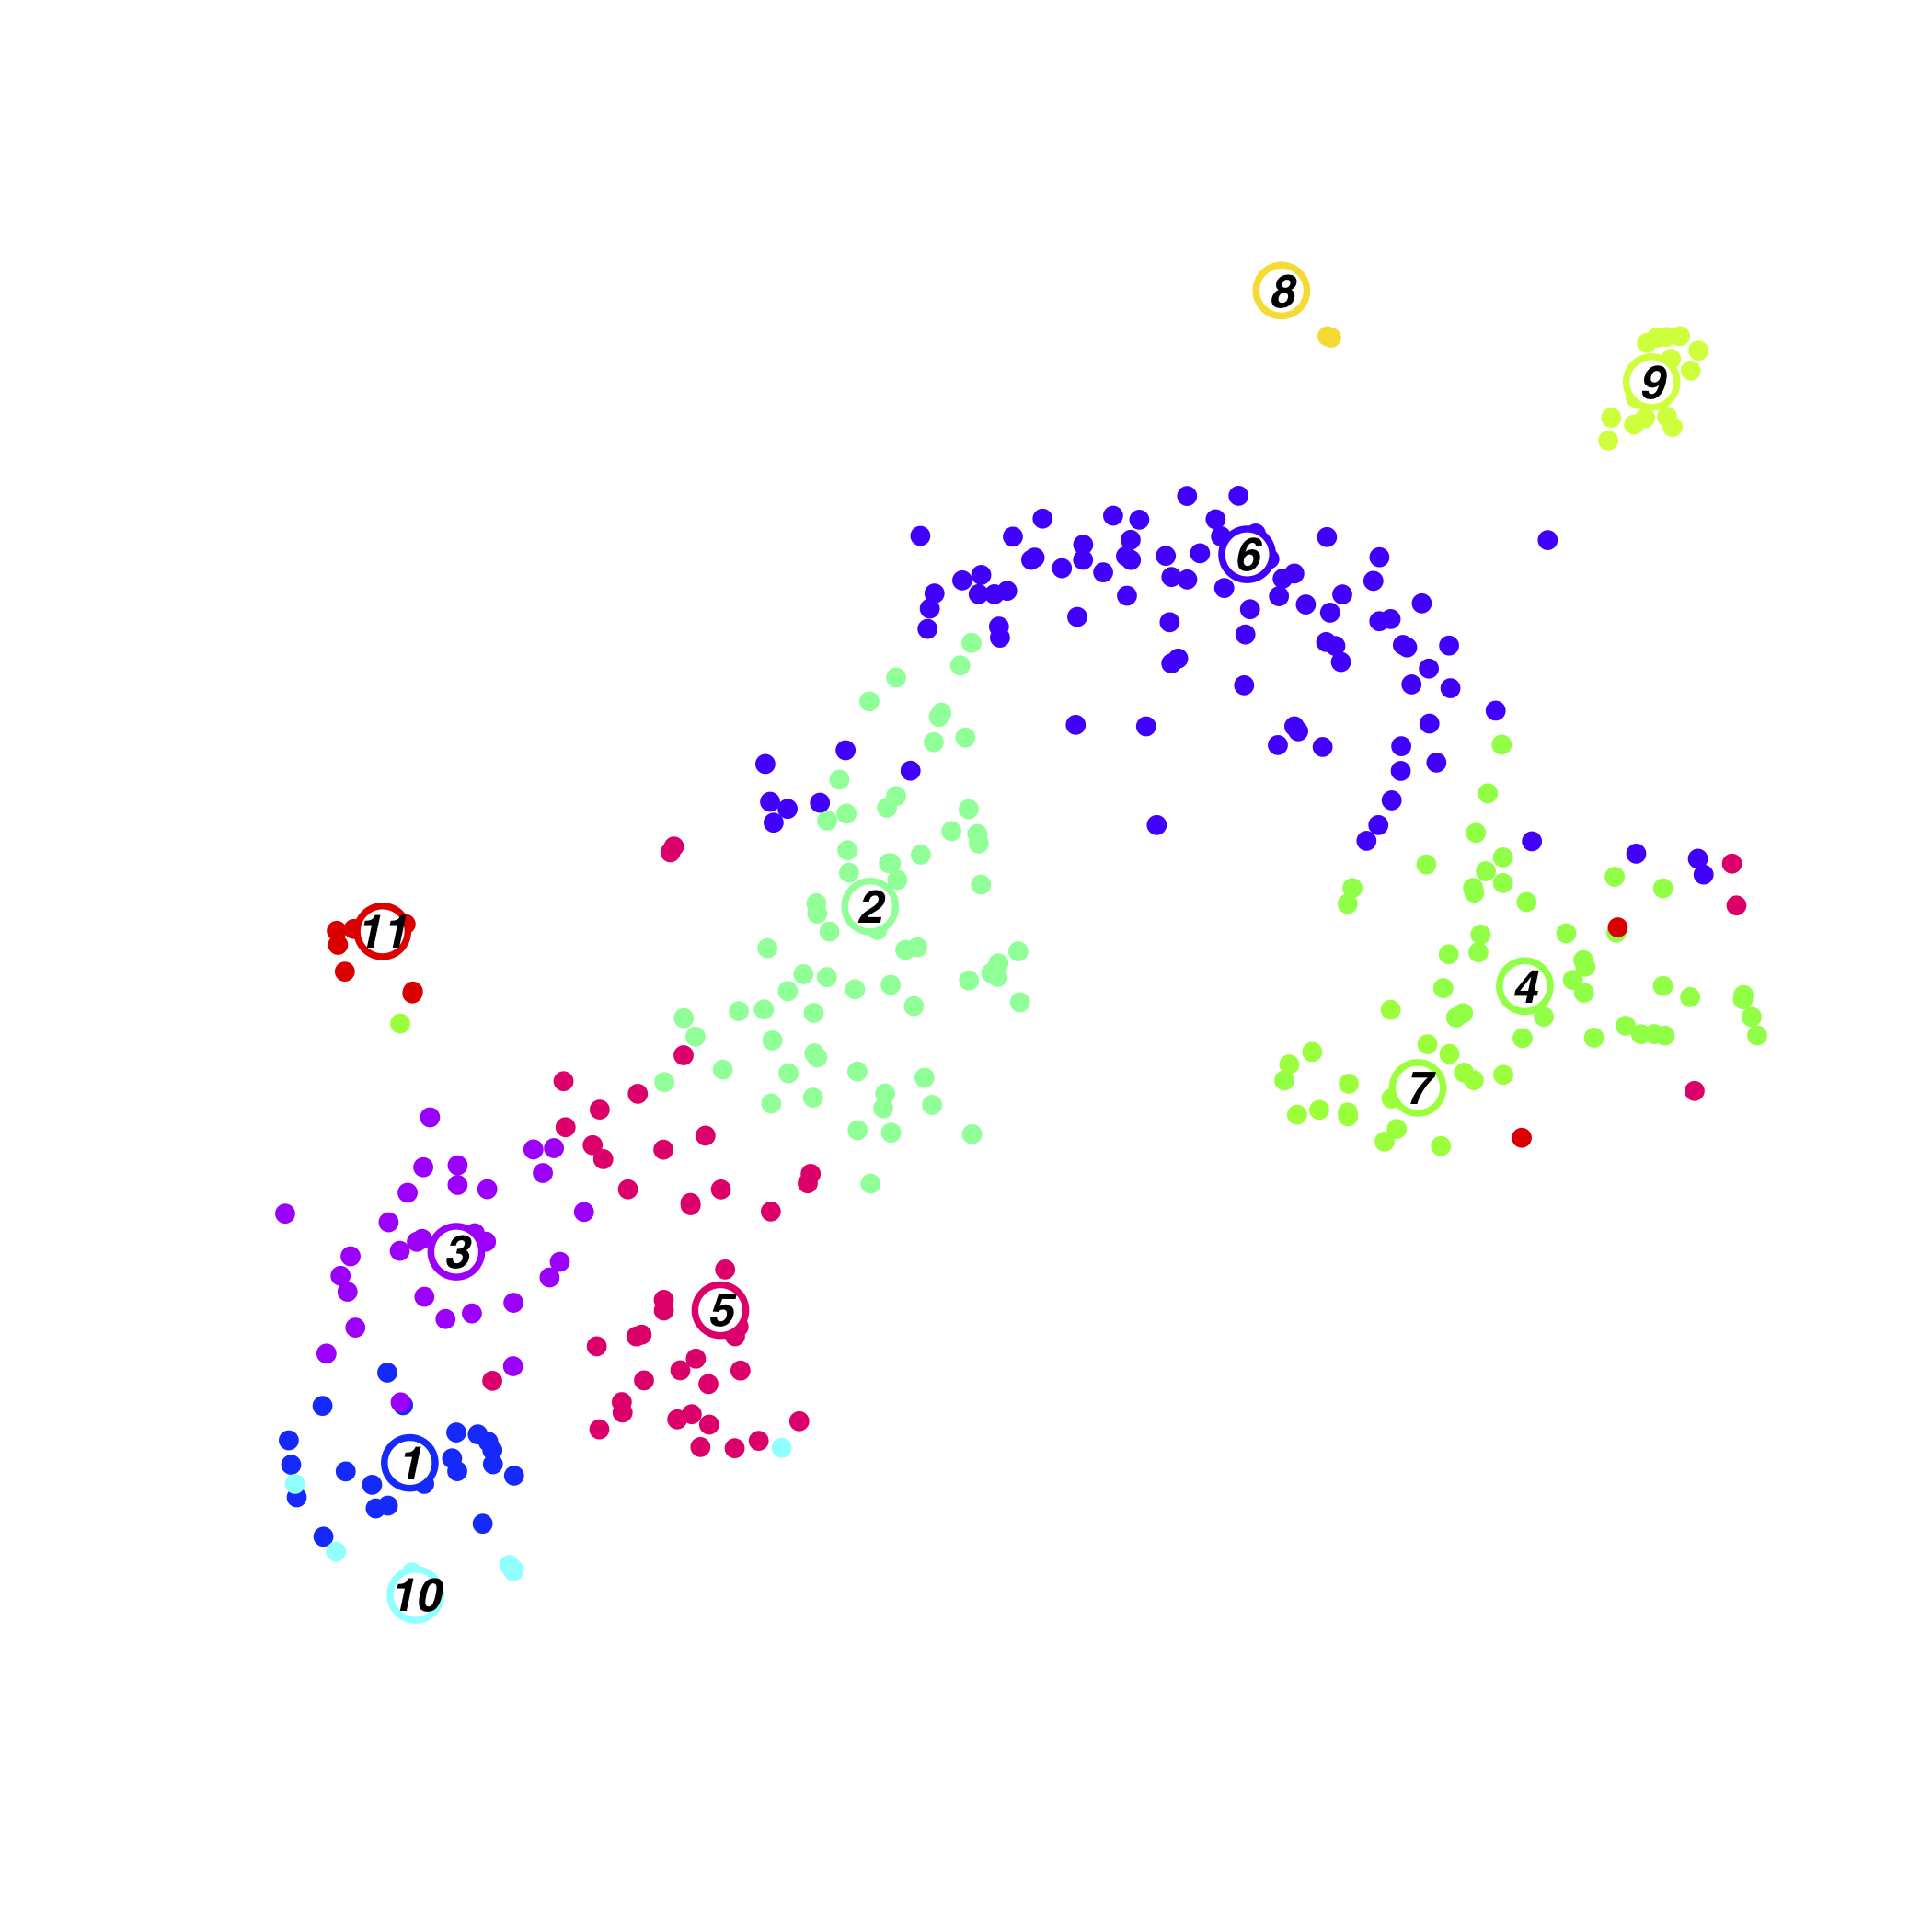
Neonatal Cluster
zscore of mean expression
log2 mean expression
FractionDotPlot for Clusters
zscore of mean expression
log2 mean expression
3 Genes Scatterplot
Differential Expression Cluster versus all other
mean.cl = mean expression within cluster, mean.other.cl = mean expression in all other cluster, log2FC = log2 Foldchange selected clusters versus all other
pval = p-value, padj = adjusted p-value
Differential Expression Cluster1 against Cluster2
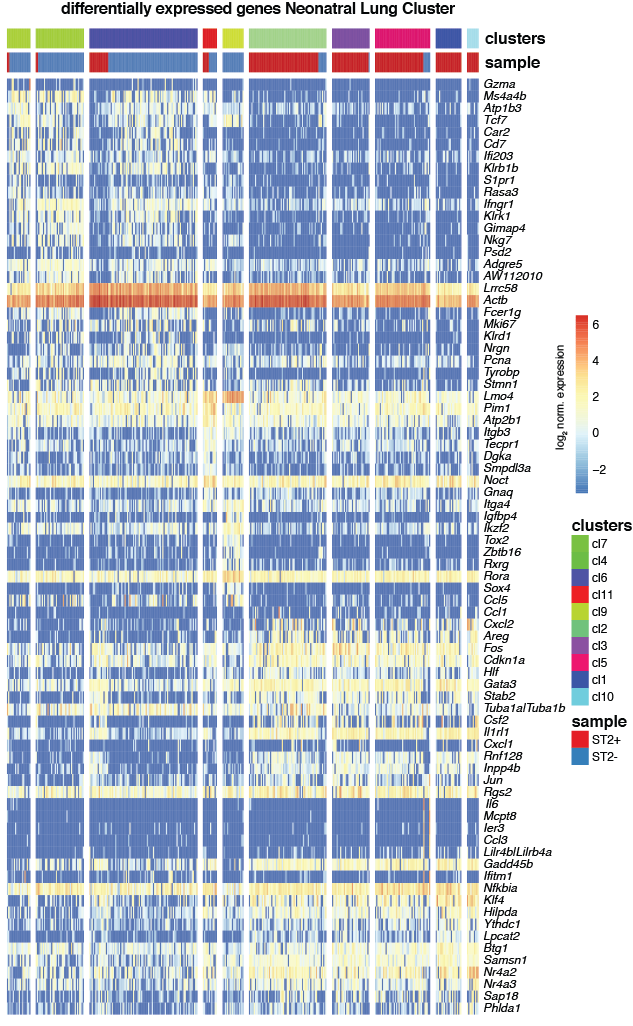
Heatmap showing the log2 normalized expression of the top 10 differentially expressed genes (P<0.05, Methods) in increasing order of p-values across clusters (y-axis) and cells (x-axis) for neonatal lung. Duplicated genes, Mid1, Malat1, Xist, Kcnq1ot1 and the ensemble of all Gm-, RP, Hsp, A4300 genes were removed. Differentially expressed genes were obtained by comparing gene expression of cells of the respective cluster to all other clusters. Color bars indicate RaceID3 cluster and sample-of-origin for each cell.
Shiny App Contact: Patrice Zeis
If red progress bar keeps appearing, shiny app is loading. Please wait patiently!BM Dataset
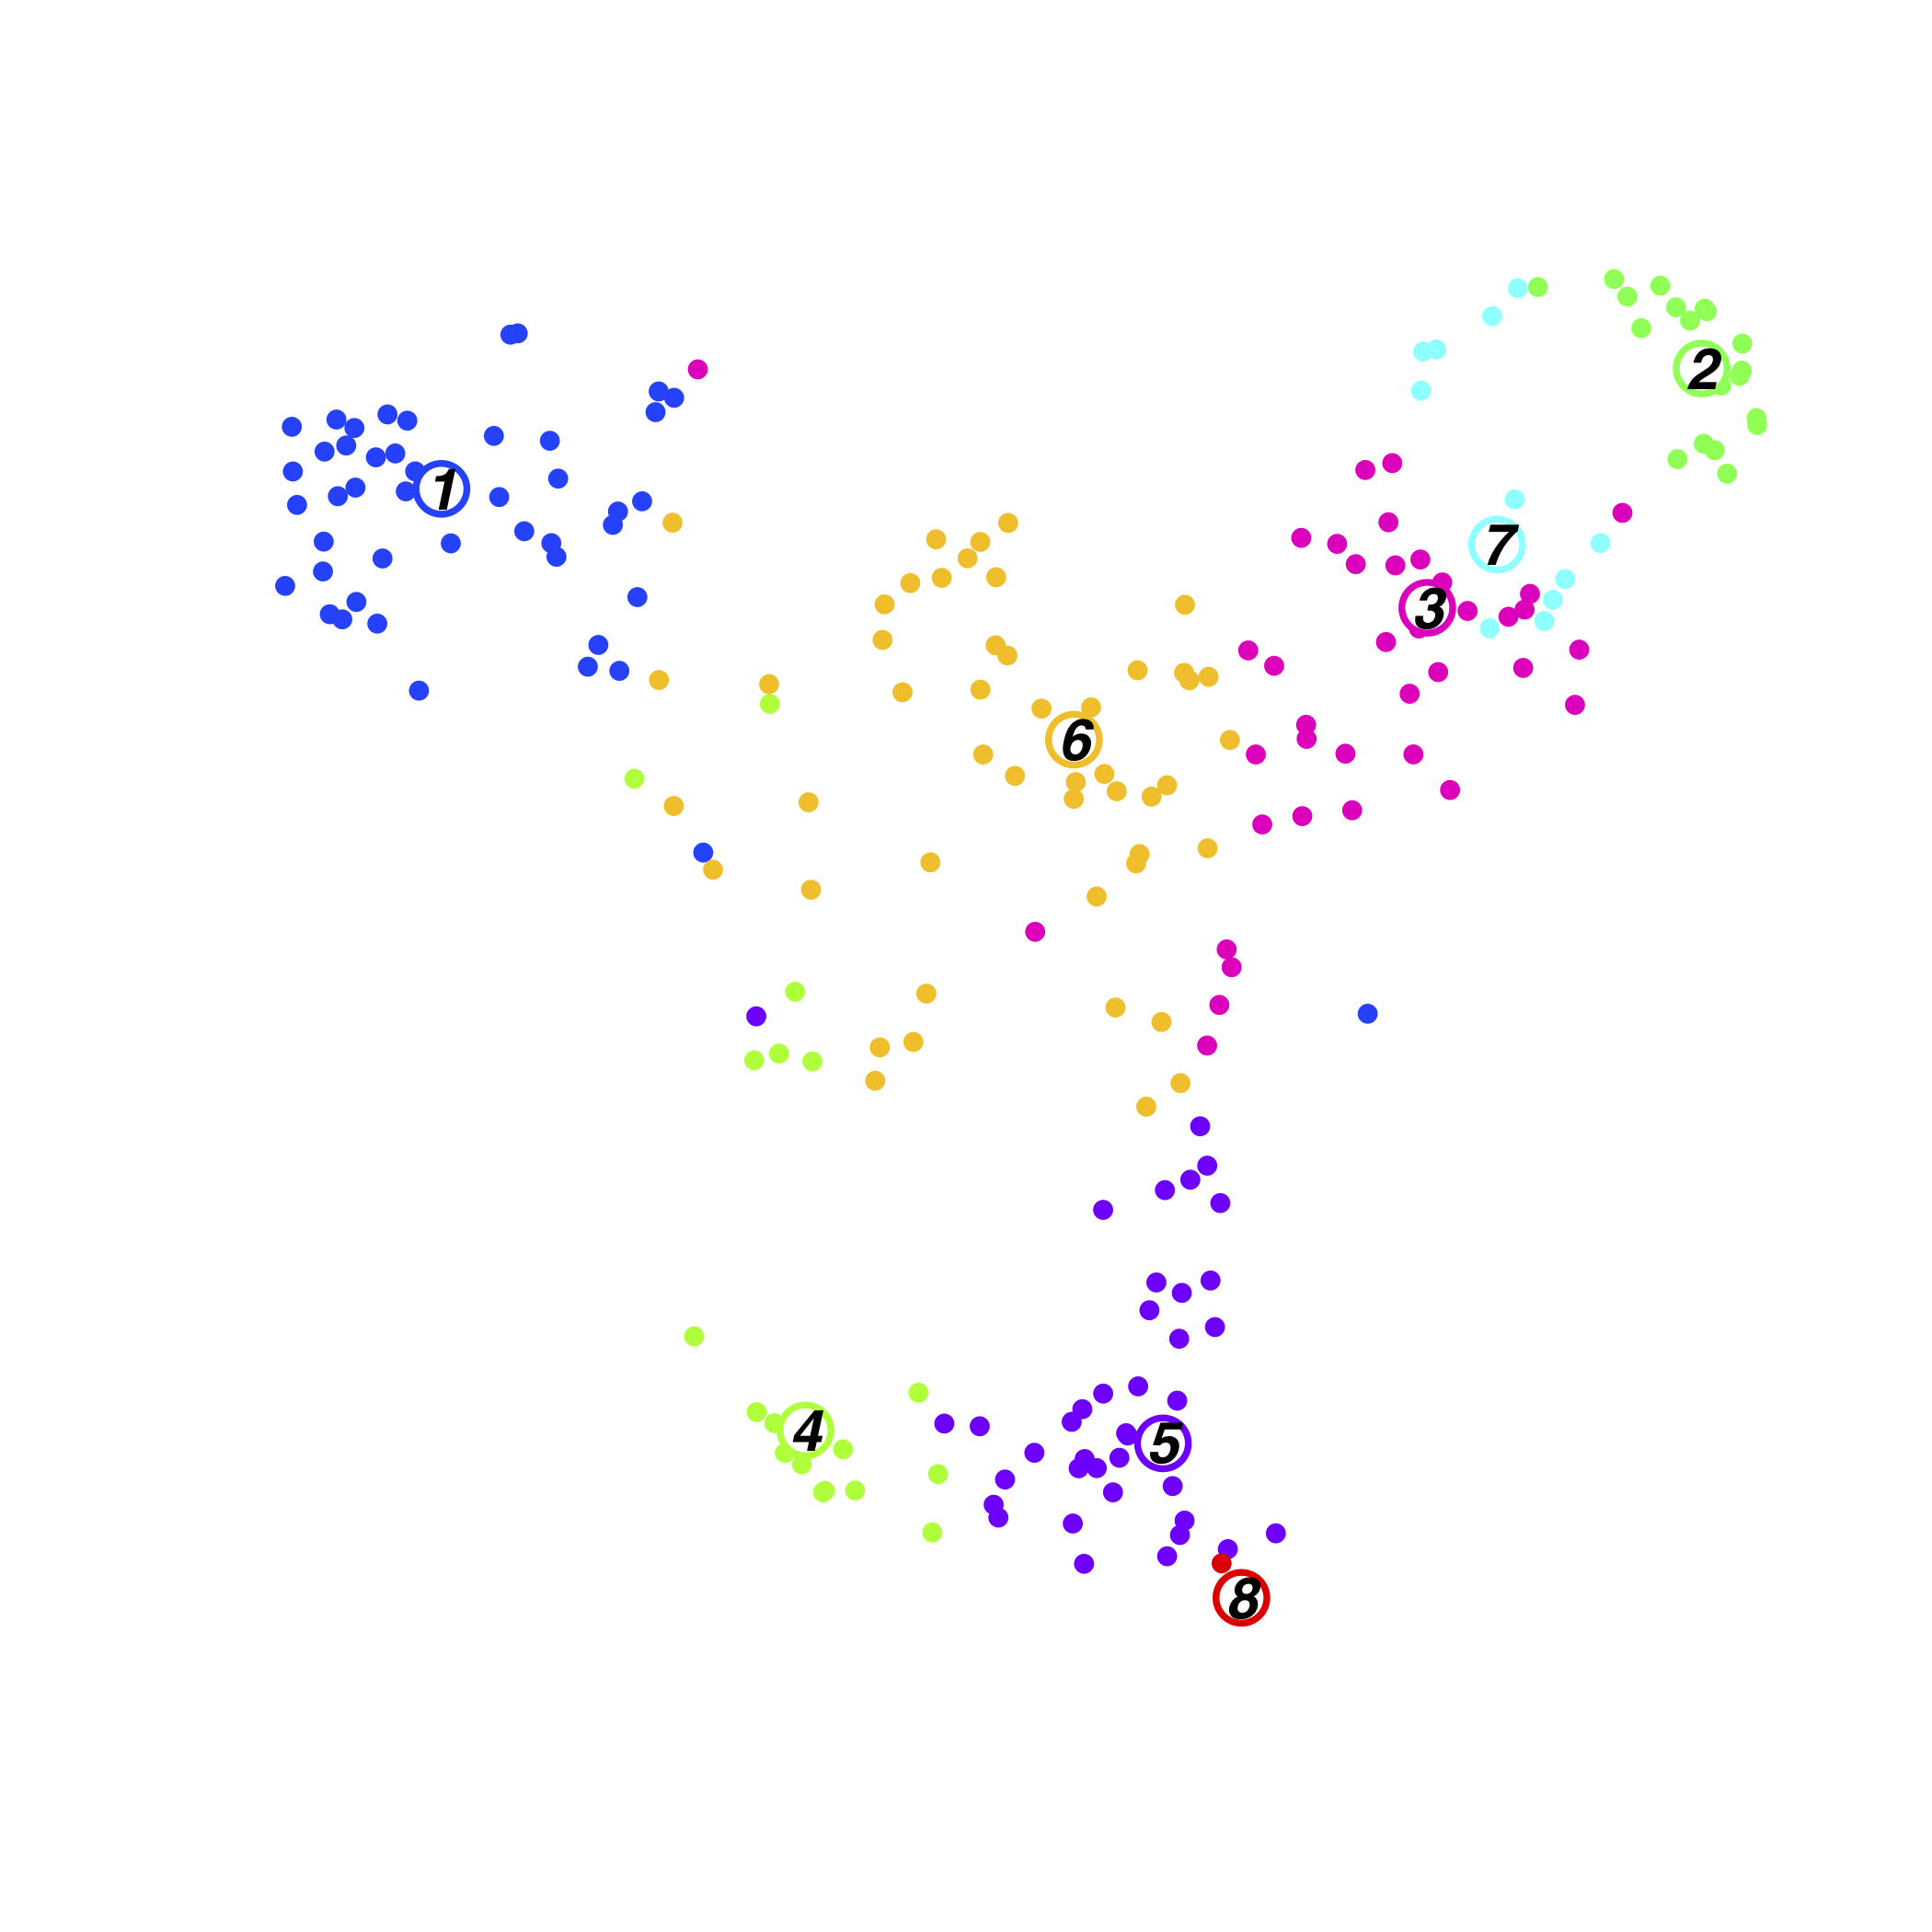
Resting BM Cluster
zscore of mean expression
log2 mean expression
FractionDotPlot for Clusters
zscore of mean expression
log2 mean expression
3 Genes Scatterplot
Differential Expression Cluster versus all other
mean.cl = mean expression within cluster, mean.other.cl = mean expression in all other cluster, log2FC = log2 Foldchange selected clusters versus all other
pval = p-value, padj = adjusted p-value
Differential Expression Cluster1 against Cluster2
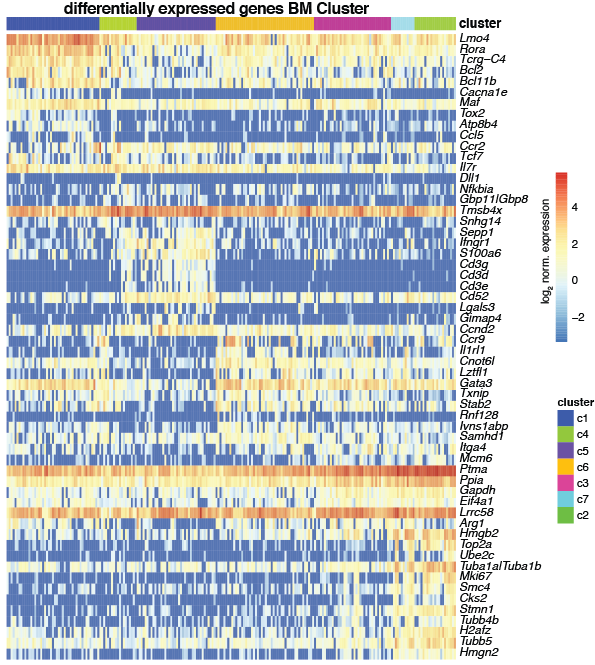
Heatmap showing the log2 normalized expression of the top 10 differentially expressed genes (P<0.05, Methods) in increasing order of p-values across clusters (y-axis) and cells (x-axis) for Il18r1+Icos+ Bm ILCs. Duplicated genes, Mid1, Malat1, Xist, Kcnq1ot1 and the ensemble of all Gm-, RP, Hsp, A4300 genes were removed. Differentially expressed genes were obtained by comparing gene expression of cells of the respective cluster to all other clusters. Color bars indicate RaceID3 cluster and sample-of-origin for each cell.
Shiny App Contact: Patrice Zeis
If red progress bar keeps appearing, shiny app is loading. Please wait patiently!Il18r1+Icos+ Cultured Subsets and Il18r1+Icos+ST2-Il17rb- Input cells
Culture/Input Cluster
Culture/Input Il18r1+Icos+ Sample information
zscore of mean expression
log2 mean expression
FractionDotPlot for Clusters
zscore of mean expression
log2 mean expression
FractionDotPlot for Samples
Il18r1+Icos+ ILC subsets
OP9_Pan = a.OP9.Pan, OP9_ST2- = b.OP9.ST2.n, OP9_ST2-Il17rb -= c.OP9.ST2.n.Il17rb.n, Input_ST2-Il17rb- = d.Input.ST2.n.Il17rb.n
zscore of mean expression
log2 mean expression
3 Genes Scatterplot
Differential Expression Cluster versus all other
mean.cl = mean expression within cluster, mean.other.cl = mean expression in all other cluster, log2FC = log2 Foldchange selected clusters versus all other
pval = p-value, padj = adjusted p-value
Differential Expression Cluster1 against Cluster2
Shiny App Contact: Patrice Zeis
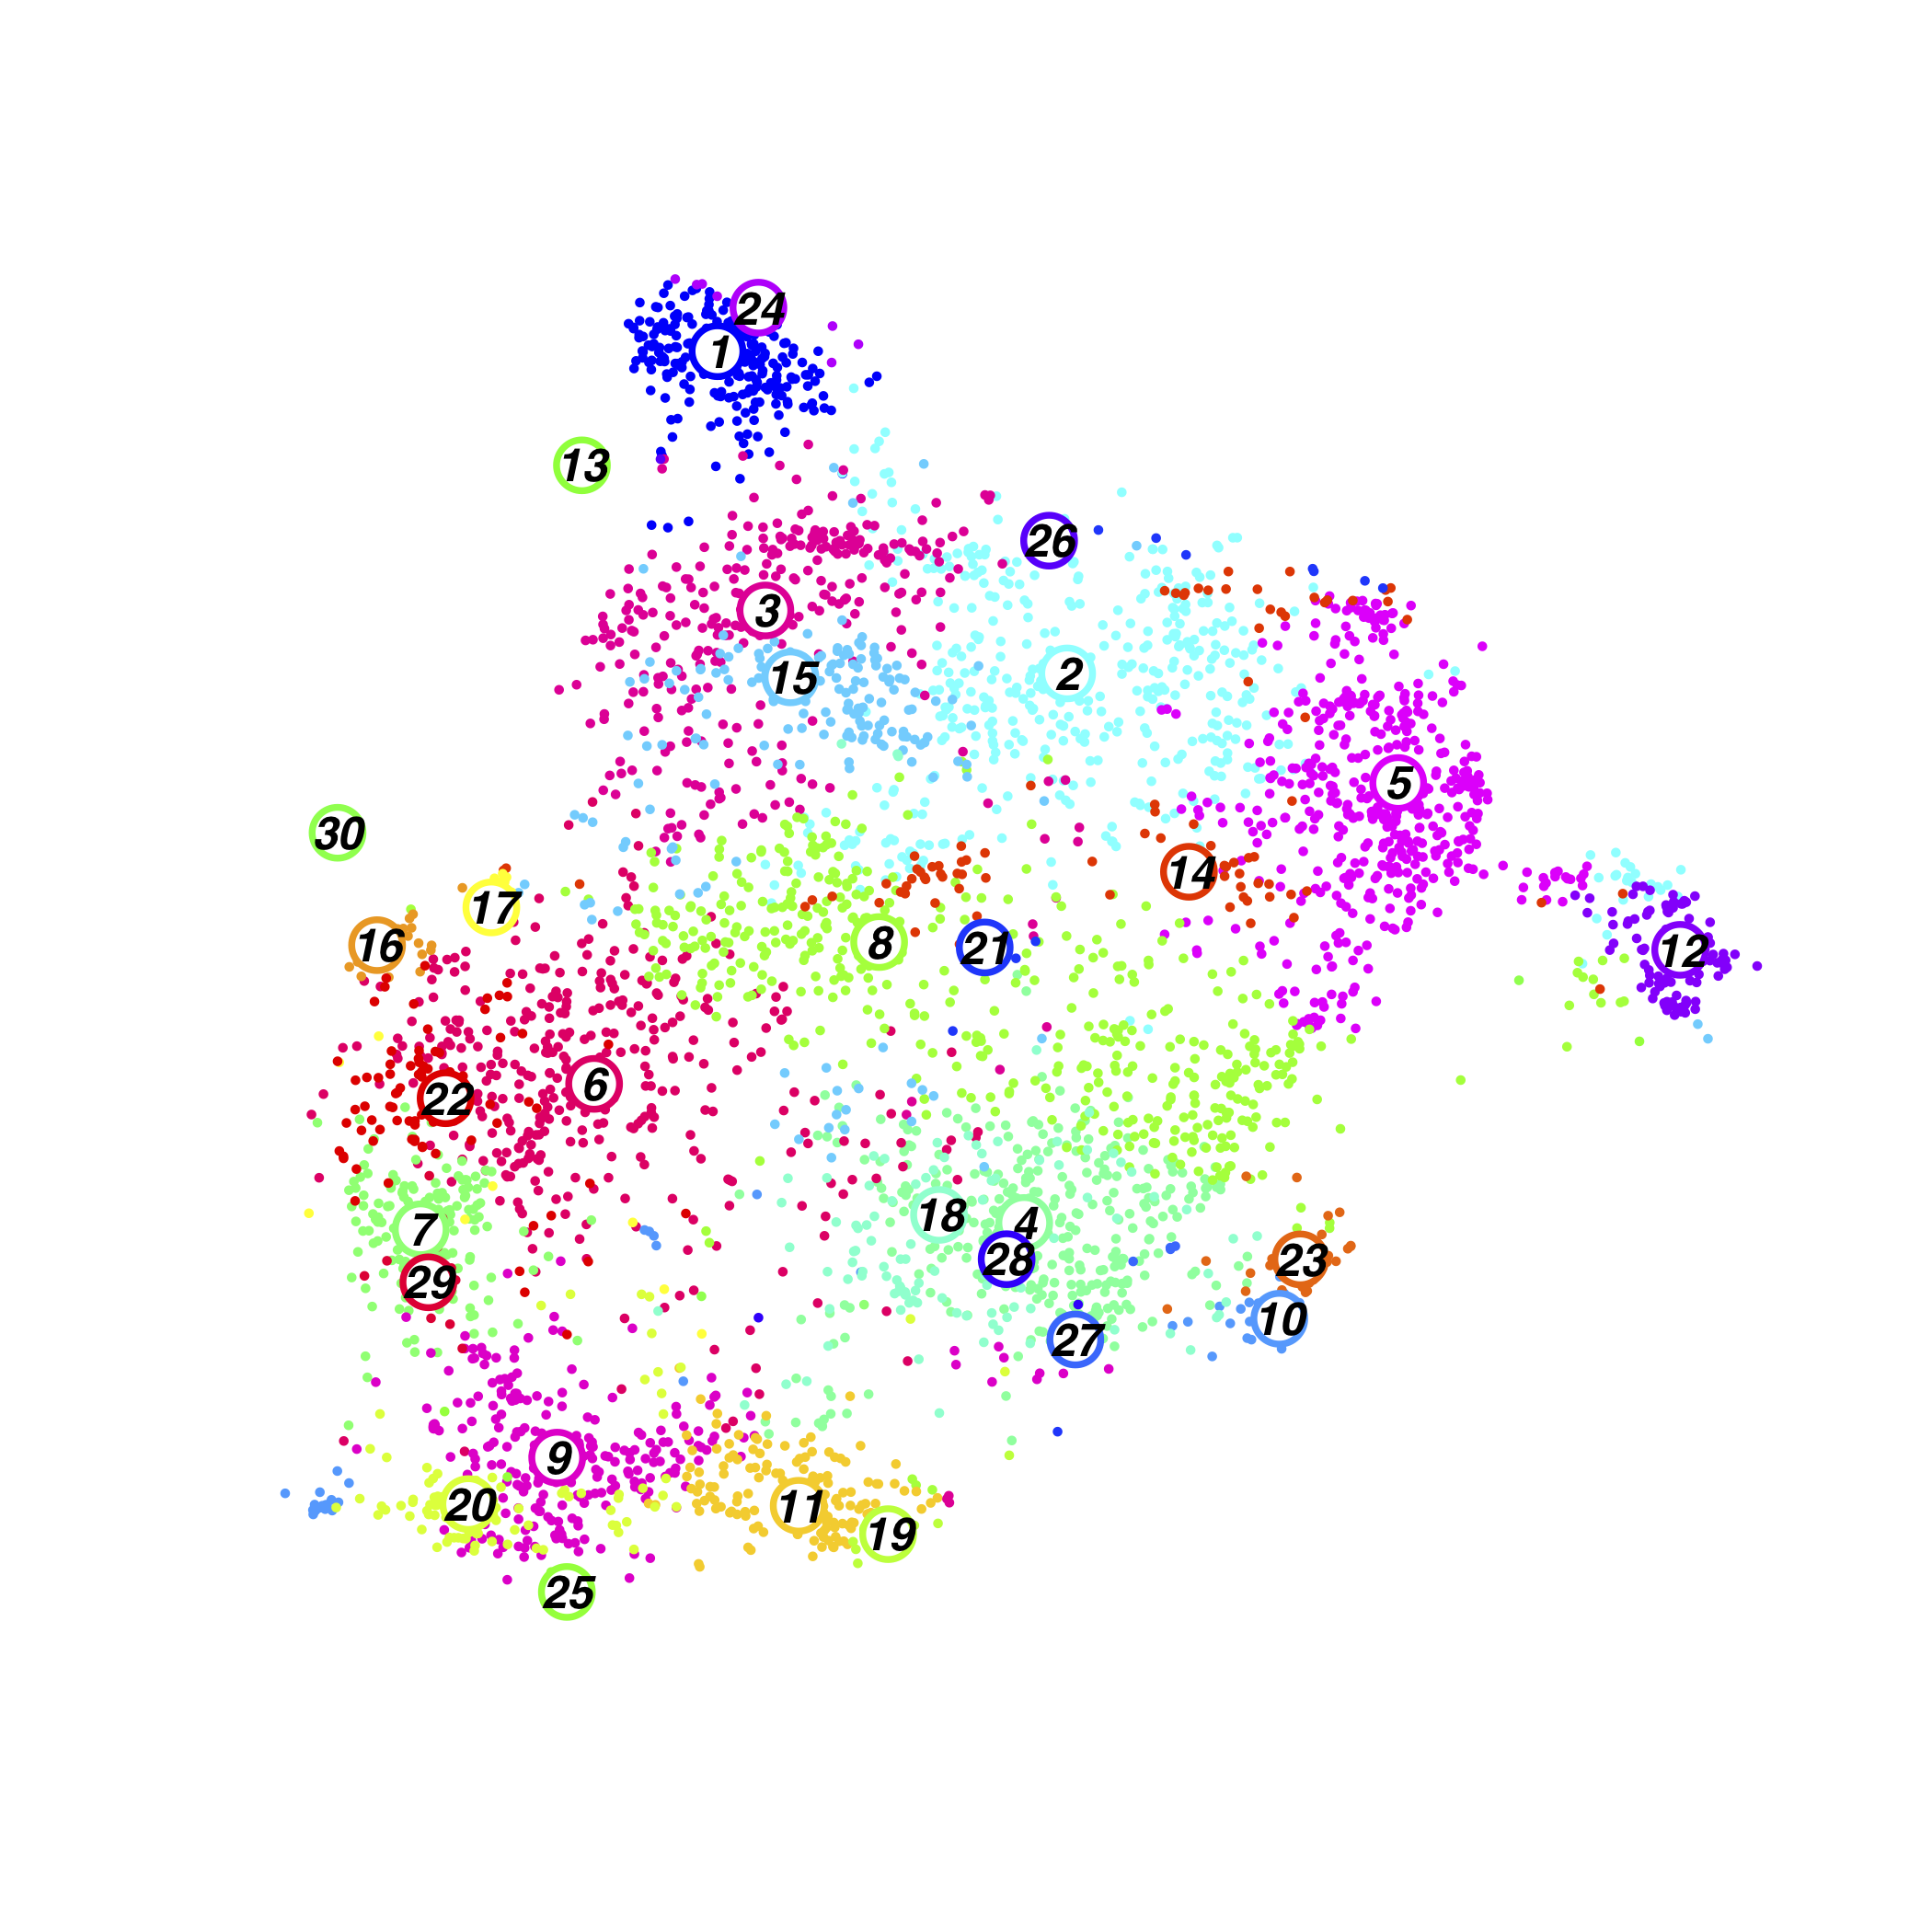
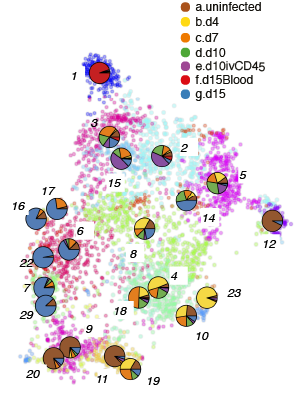
If red progress bar keeps appearing, shiny app is loading. Please wait patiently!Nippostrongylus brasiliensis infection time-course
Time-course Cluster
Time-course Cluster Composition(normalised)
FractionDotPlot for Clusters
zscore of mean expression
log2 mean expression
FractionDotPlot for Samples
zscore of mean expression
log2 mean expression
3 Genes Scatterplot
Lineage Tree
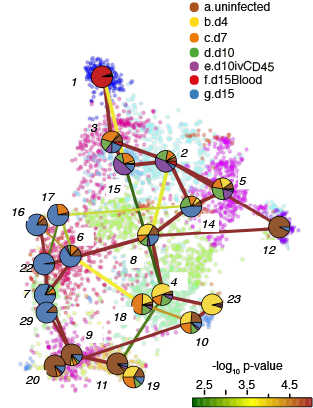
Trajectory Analysis
trajectory 12>5>2>8>6>16
trajectory 12>5>2>8>4>23
Differential Expression Cluster versus all other
mean.cl = mean expression within cluster, mean.other.cl = mean expression in all other cluster, log2FC = log2 Foldchange selected clusters versus all other
pval = p-value, padj = adjusted p-value
Differential Expression Cluster1 against Cluster2
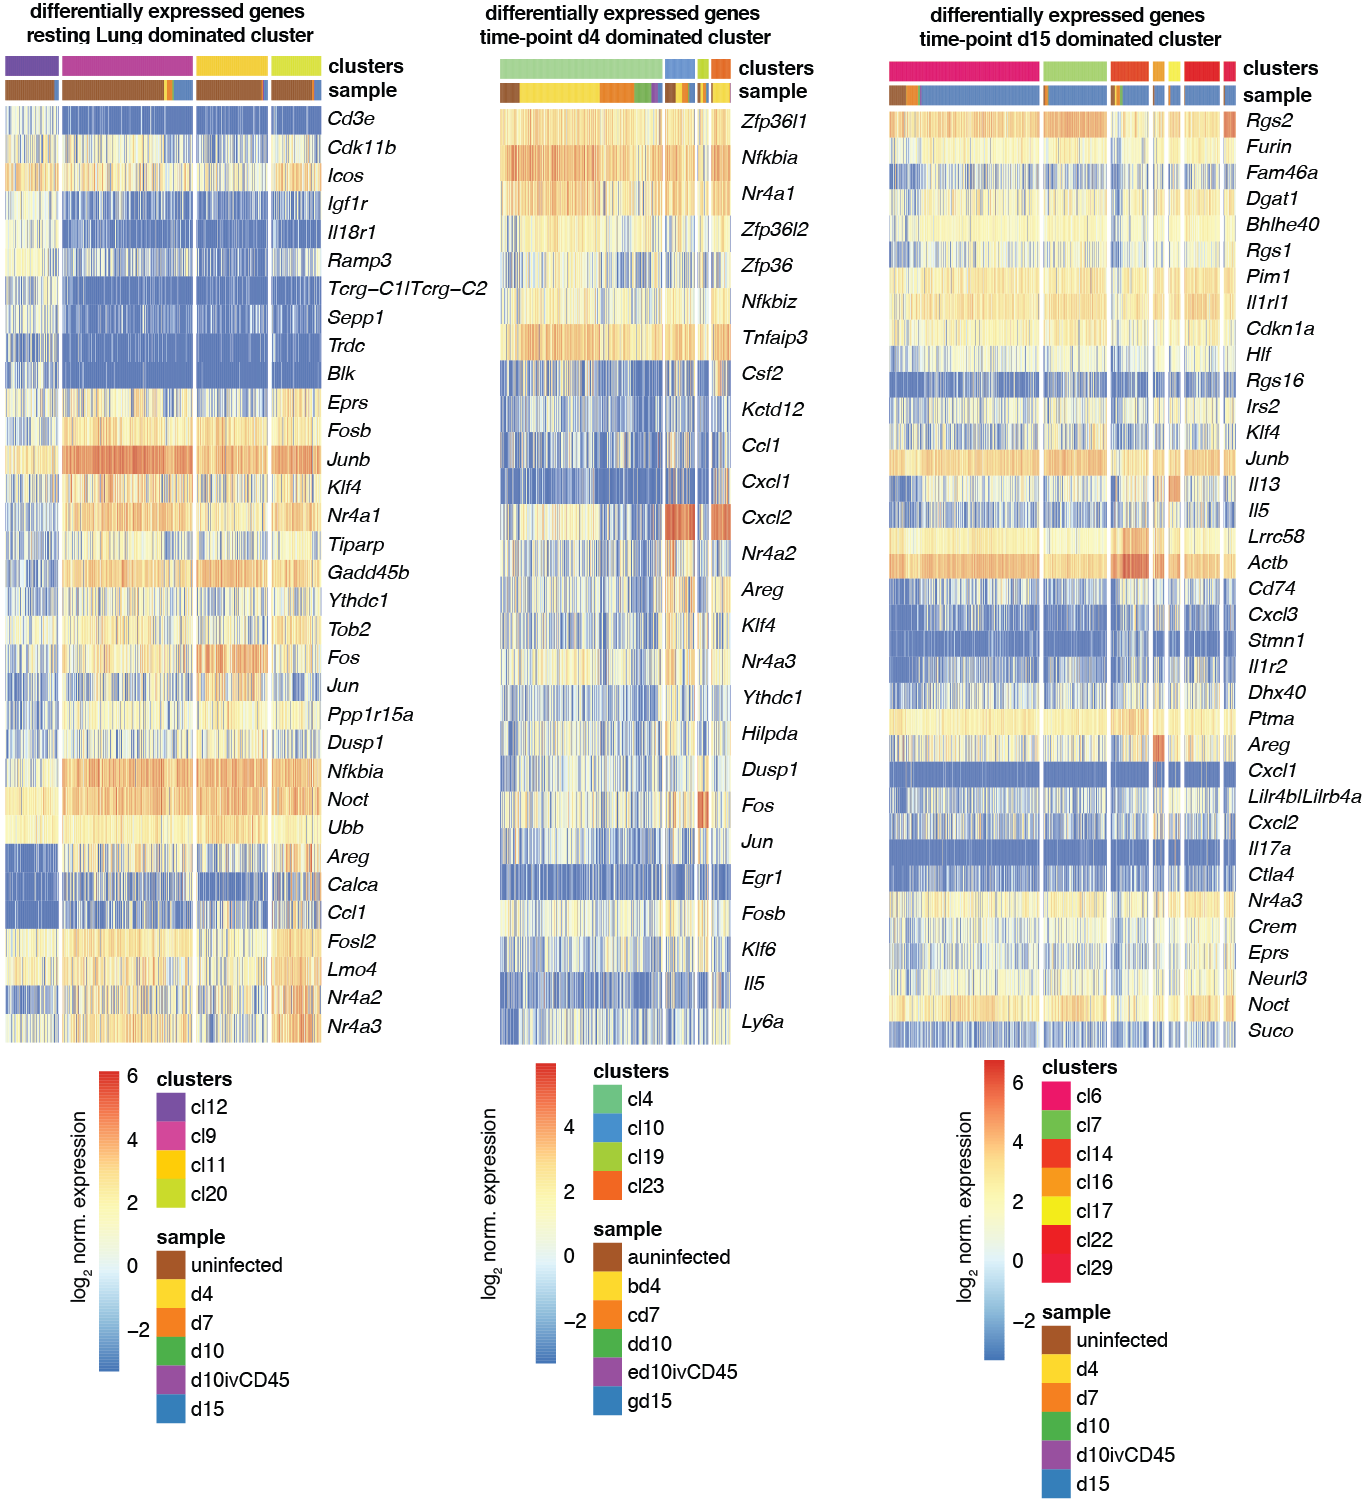
Heatmap showing the log2 normalized expression of the top 10 differentially expressed genes (Benjamini Hochberg corrected P<0.05, Methods) in increasing order of p-values across clusters (y-axis) and cells (x-axis) for different sets of clusters with highest relative contribution of the respective sample (after normalization for sample size). Duplicated genes, Mid1, Malat1, Xist, Kcnq1ot1 and the ensemble of all Gm-, RP, Hsp, A4300 genes were removed. Differentially expressed genes were obtained by comparing gene expression of cells of the respective cluster to all other clusters. Color bars indicate RaceID3 cluster and sample-of-origin for each cell.
Shiny App Contact: Patrice Zeis
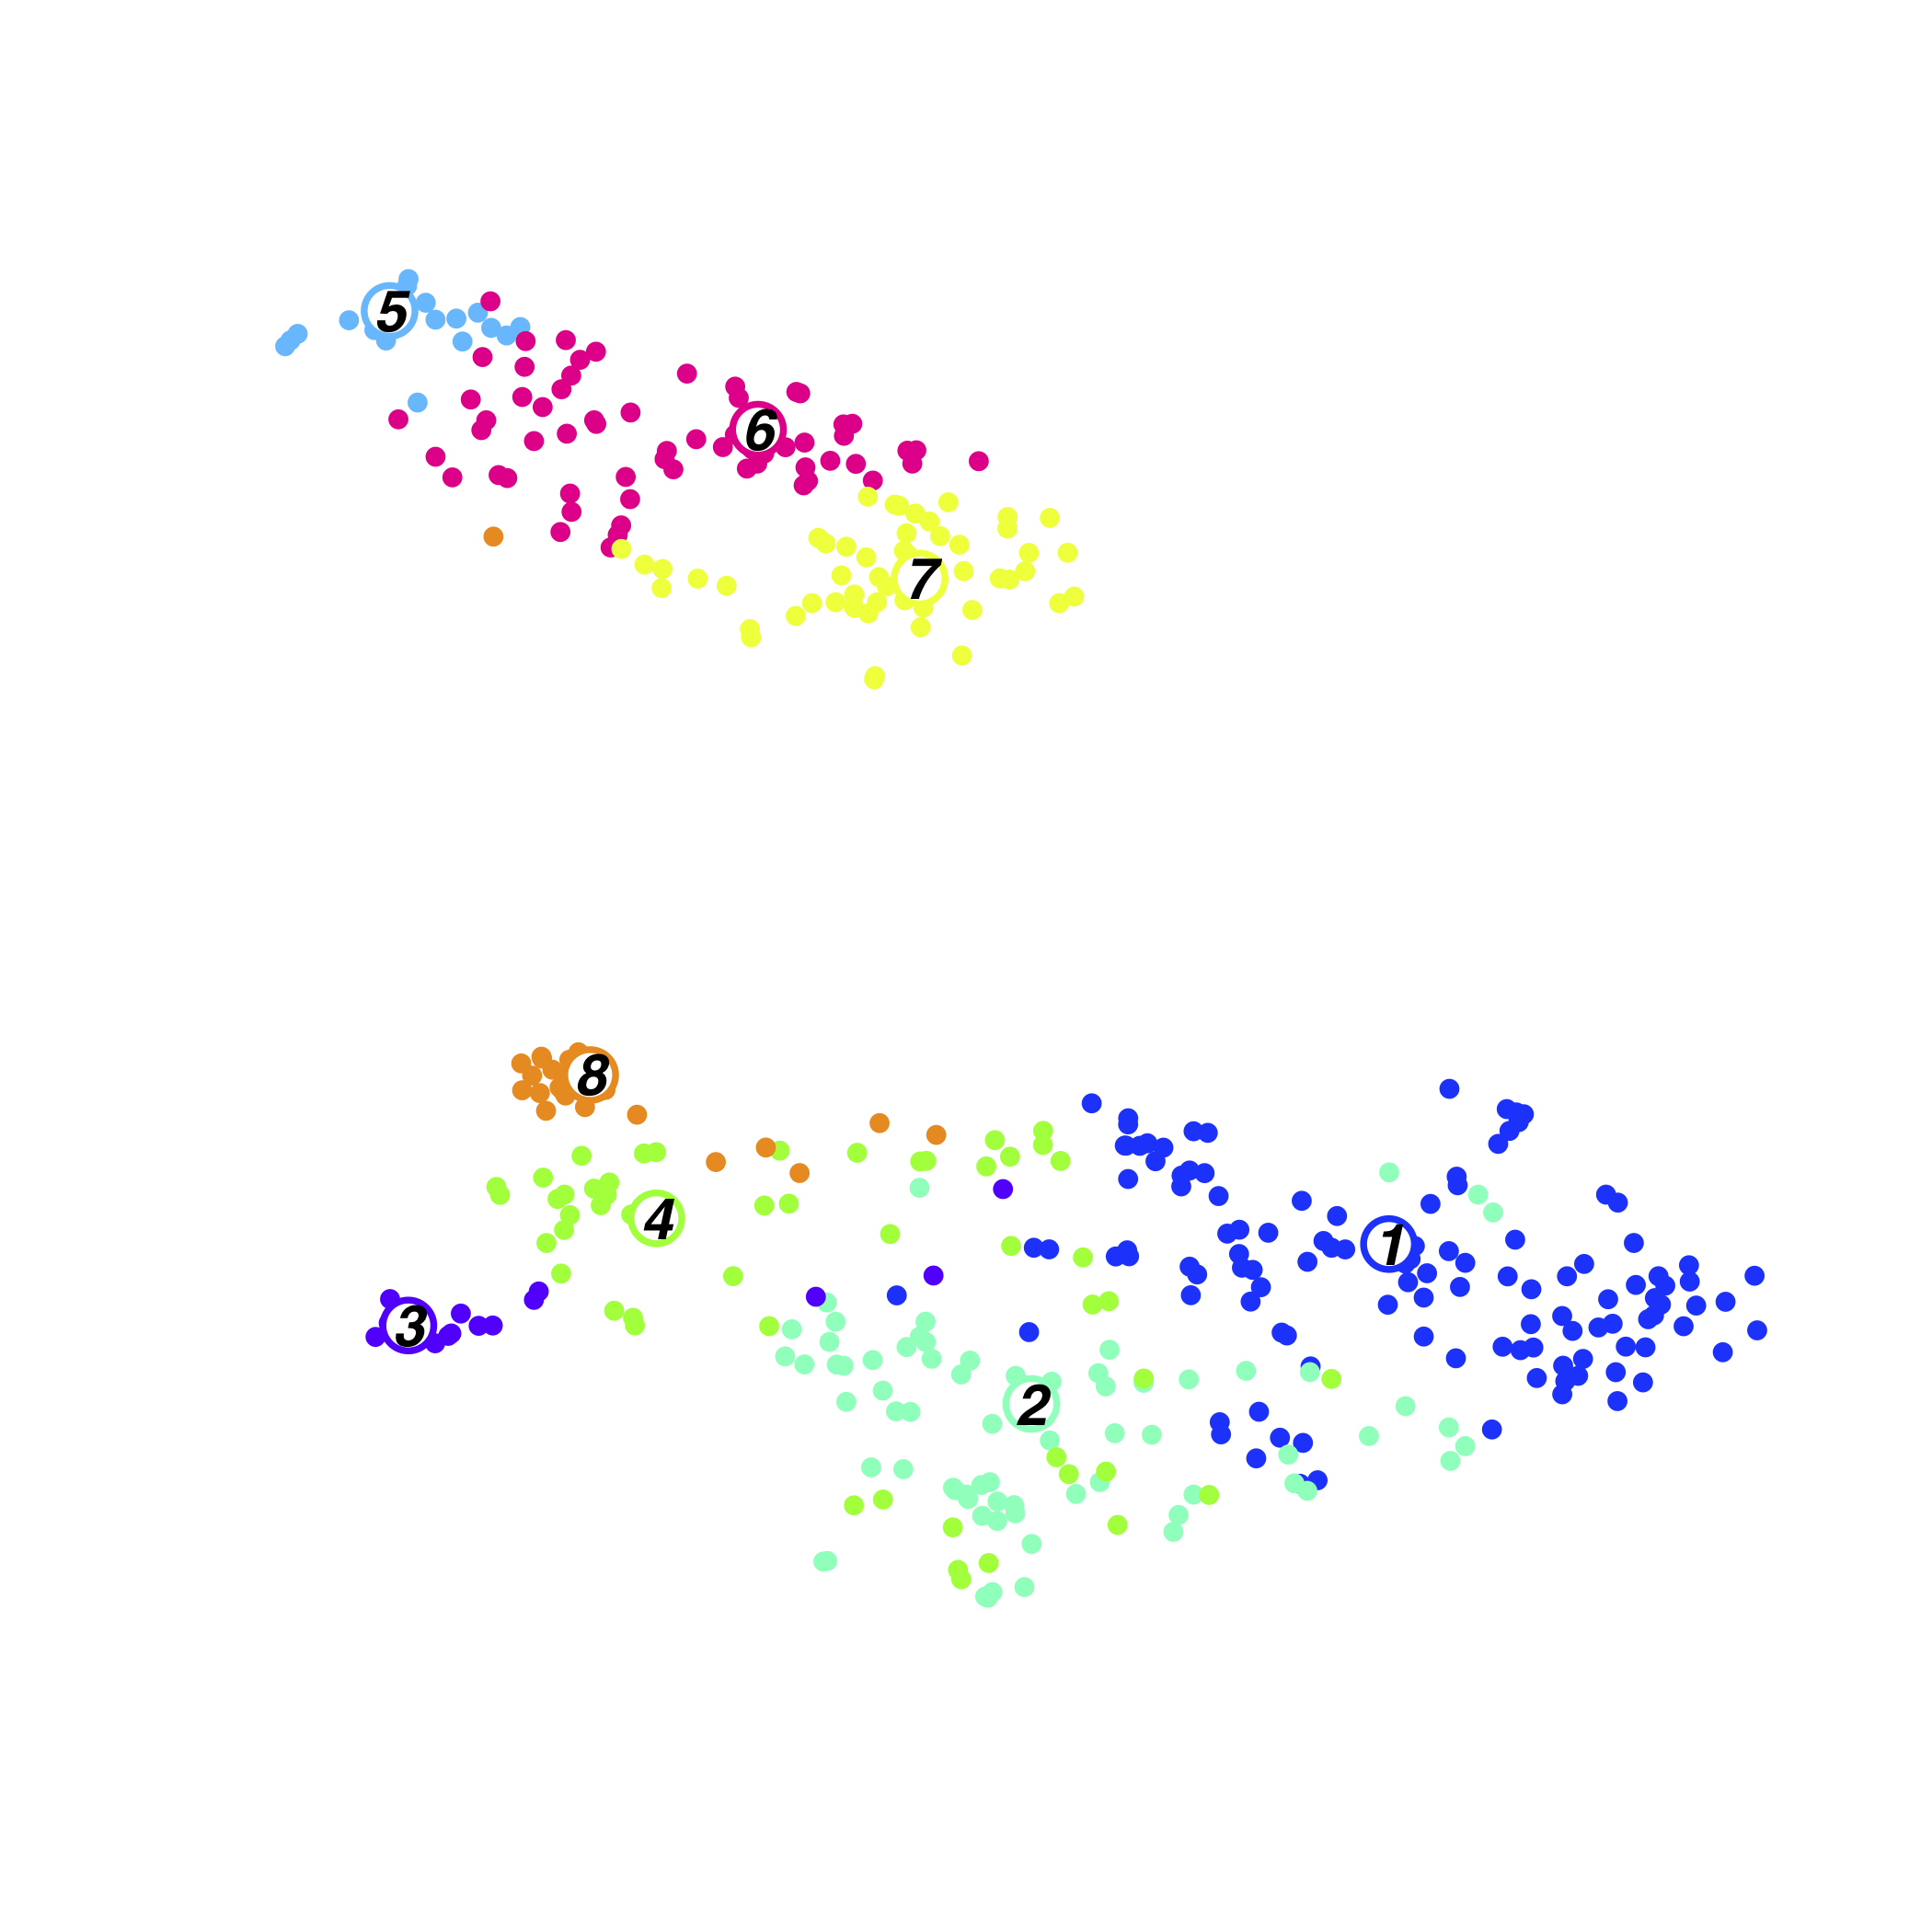
If red progress bar keeps appearing, shiny app is loading. Please wait patiently!Parabiosis d15 Nippostrongylus brasiliensis infection
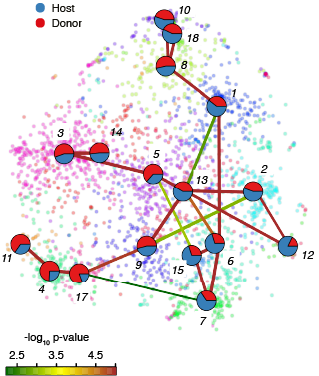
Parabiosis Cluster
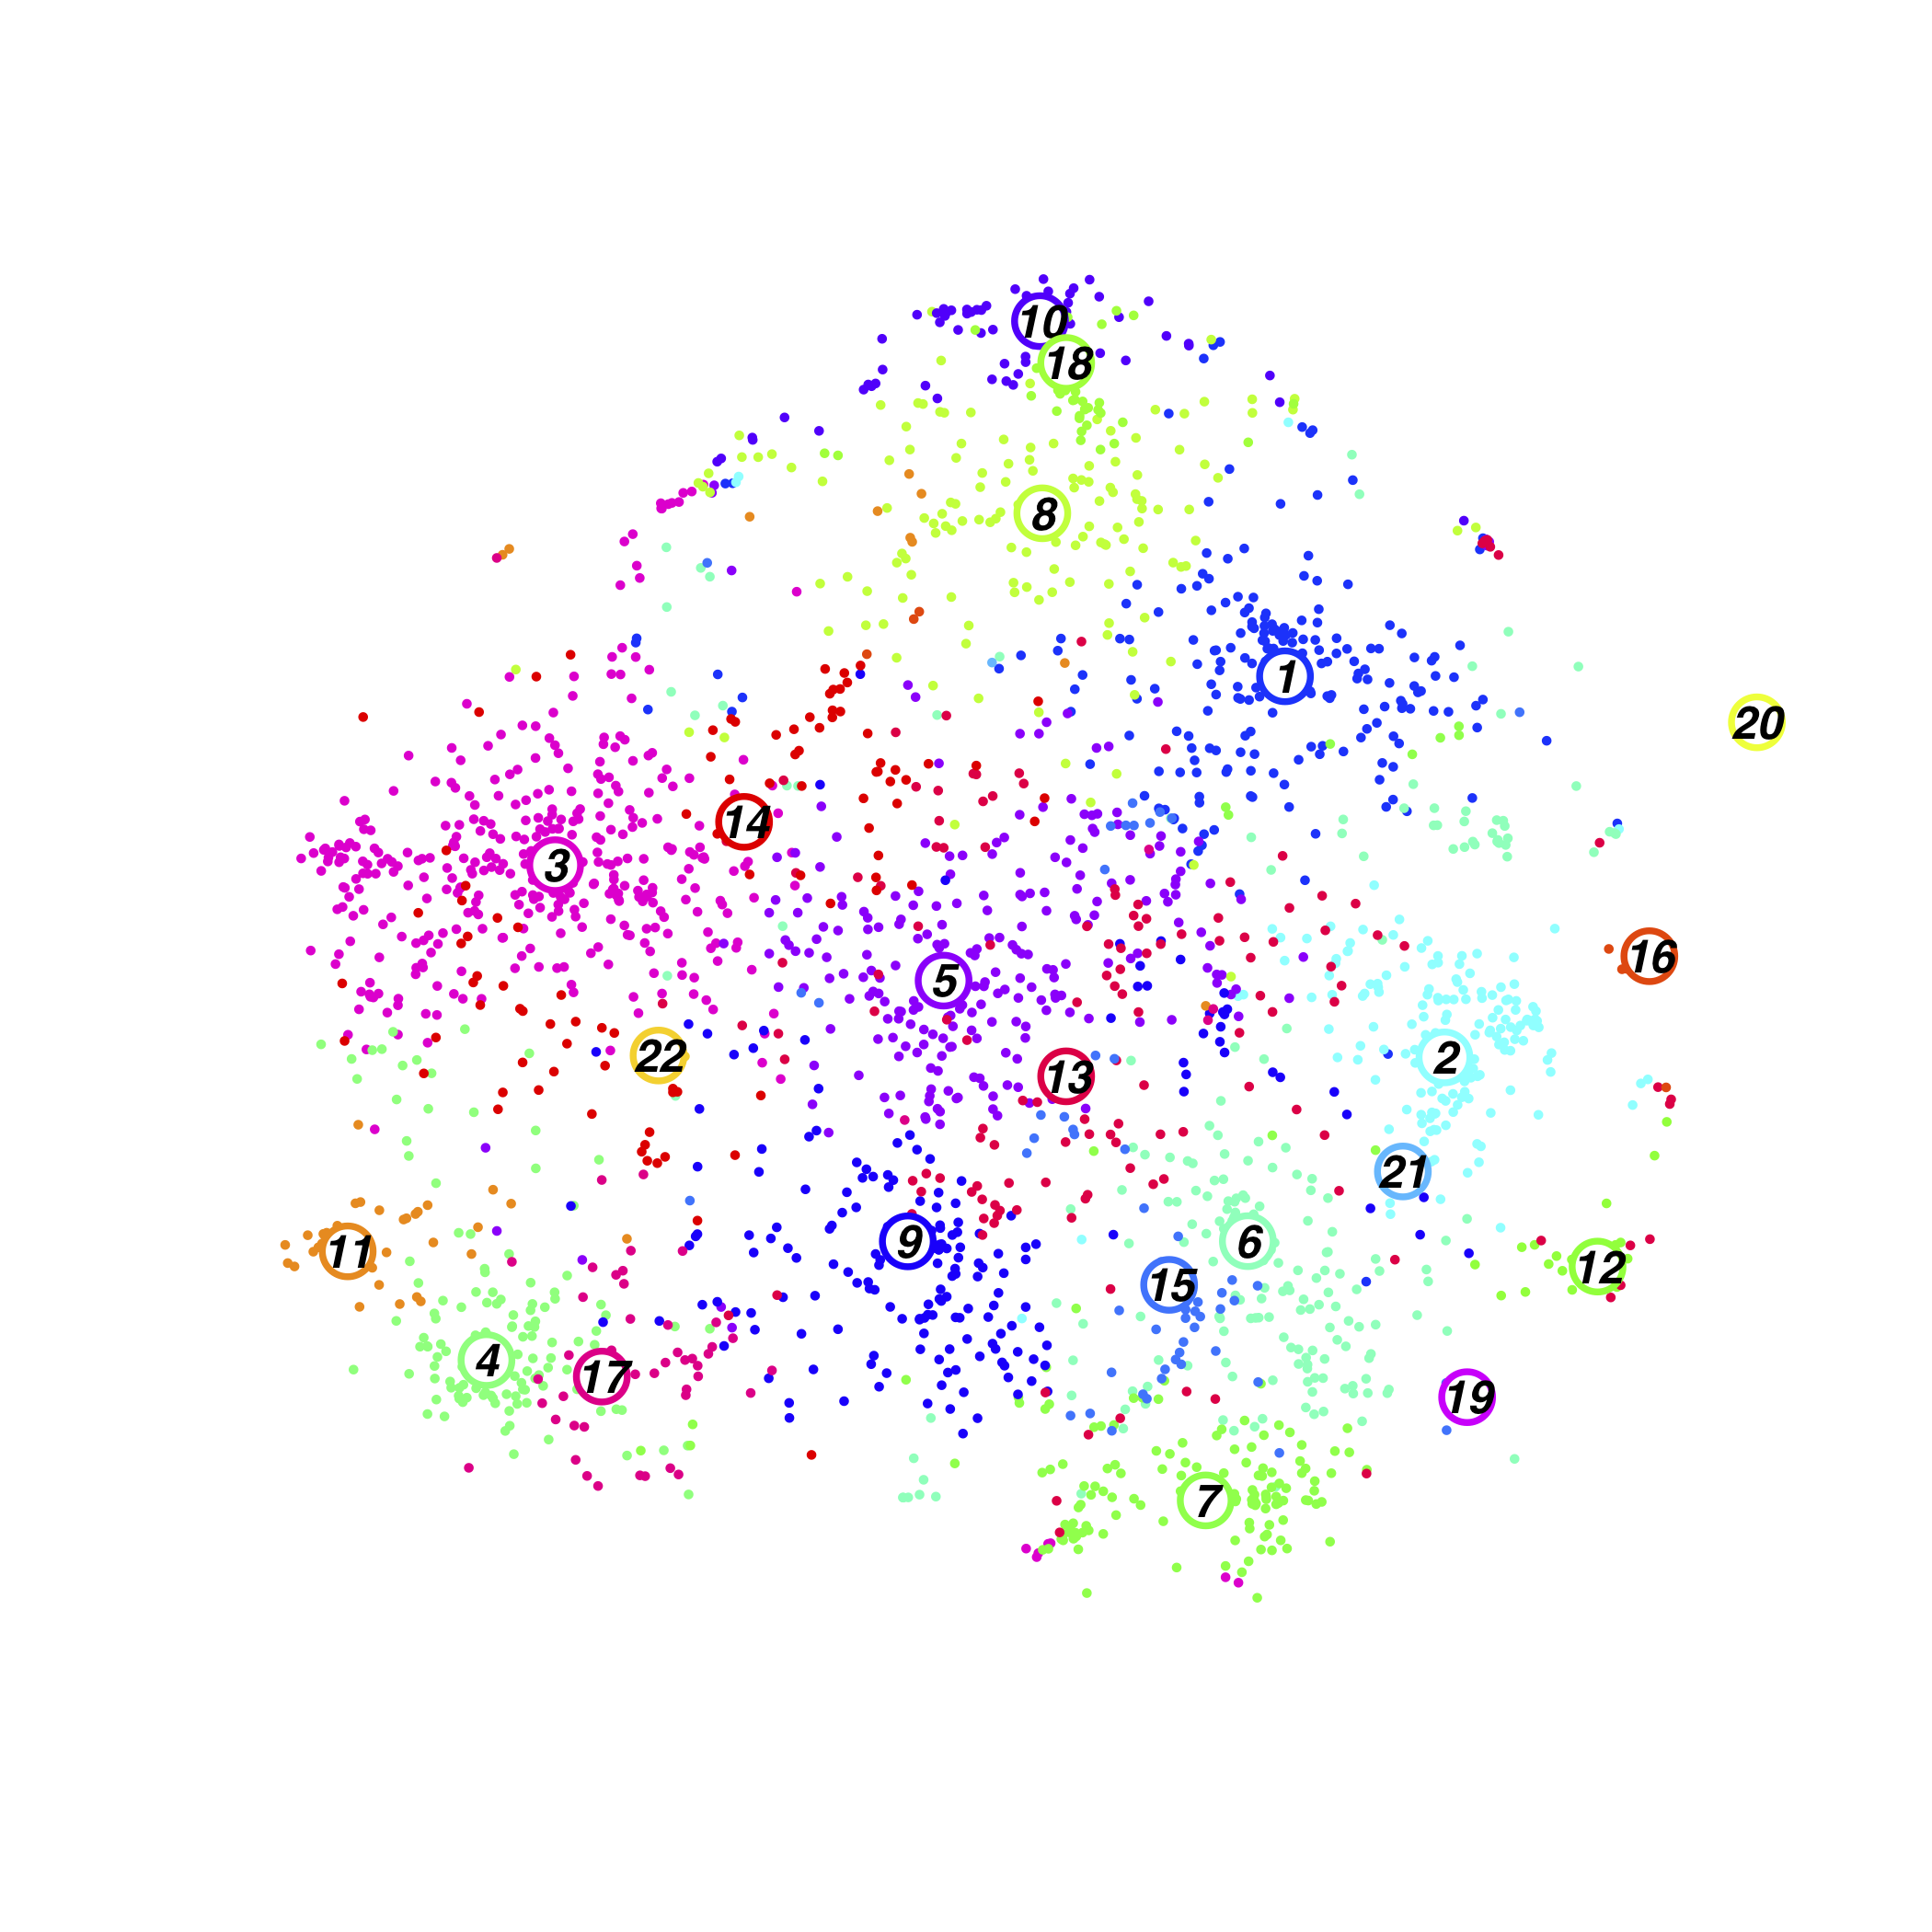
Parabiosis Cluster Composition(normalised)
FractionDotPlot for Clusters
zscore of mean expression
log2 mean expression
Differential Expression Cluster versus all other
mean.cl = mean expression within cluster, mean.other.cl = mean expression in all other cluster, log2FC = log2 Foldchange selected clusters versus all other
pval = p-value, padj = adjusted p-value
Differential Expression Cluster1 against Cluster2
Shiny App Contact: Patrice Zeis
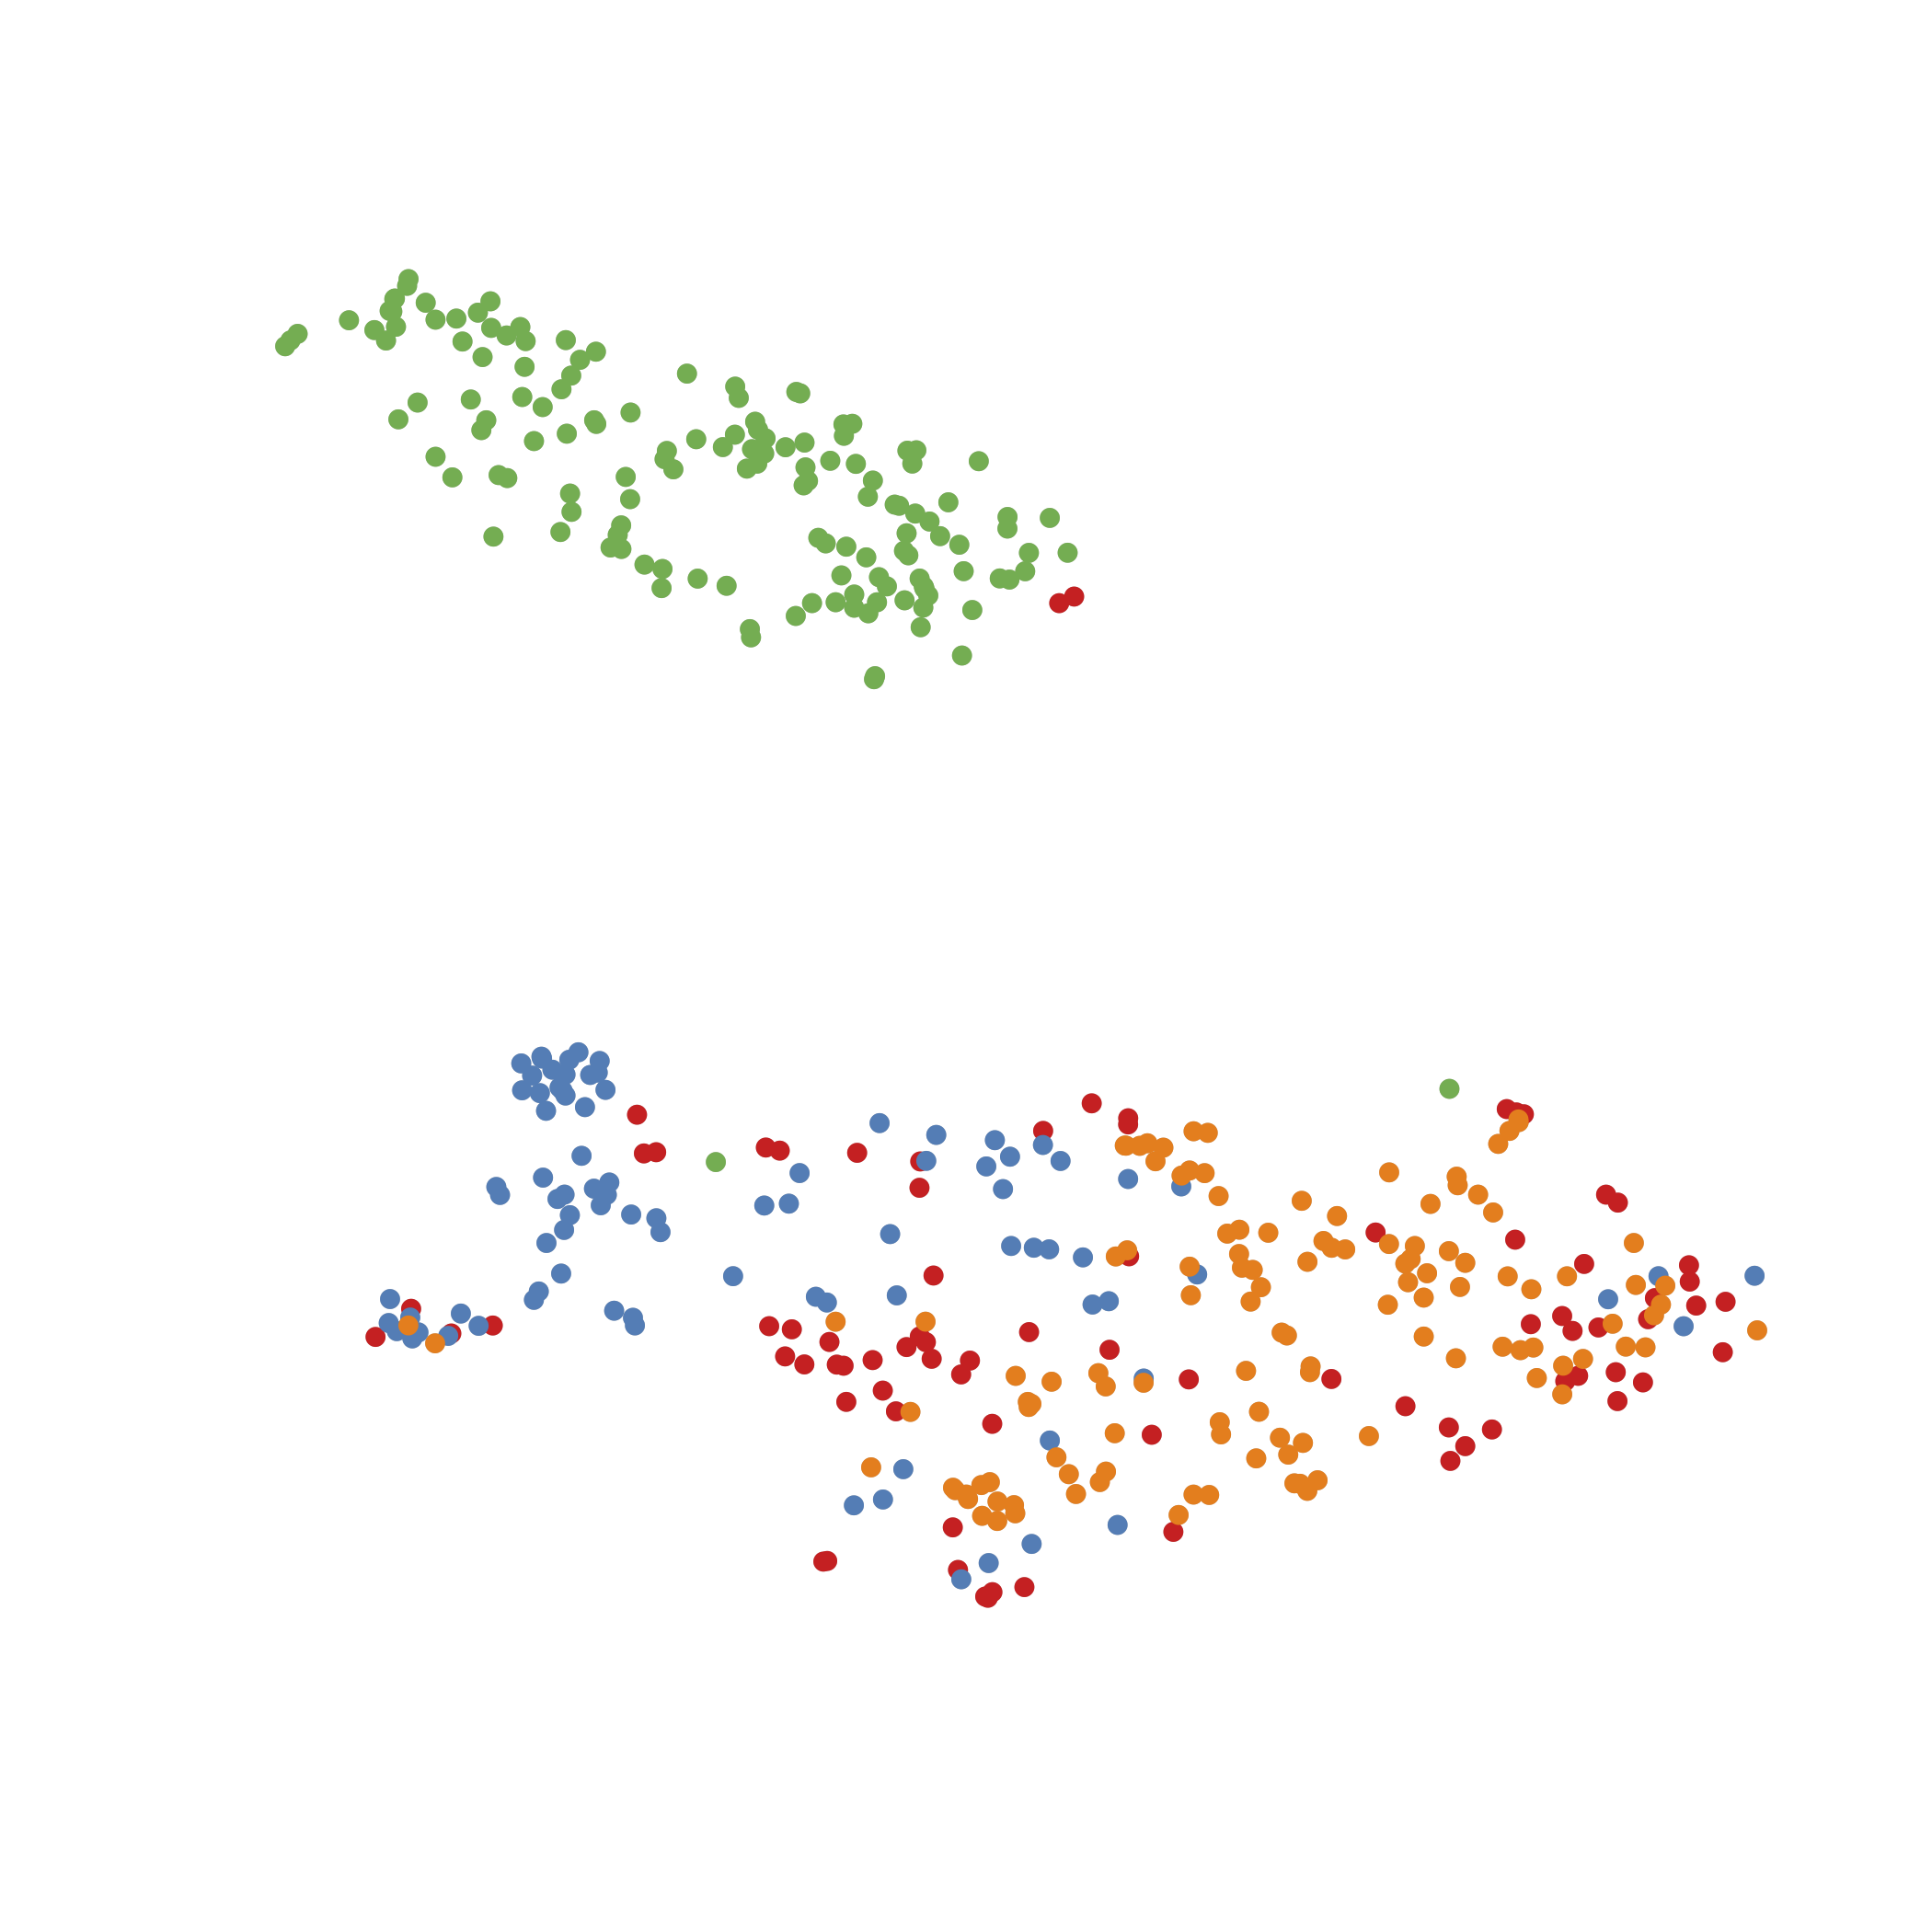
If red progress bar keeps appearing, shiny app is loading. Please wait patiently!Shield Chimera d15 Nippostrongylus brasiliensis infection
Shield Chimera Cluster
Shield Chimera Cluster Composition(normalised)
FractionDotPlot for Clusters
zscore of mean expression
log2 mean expression
Differential Expression Cluster versus all other
mean.cl = mean expression within cluster, mean.other.cl = mean expression in all other cluster, log2FC = log2 Foldchange selected clusters versus all other
pval = p-value, padj = adjusted p-value